


To begin with I have to say that this year has been truly one of the strangest compilation of weirdness that I have experienced ever. Just the past weekend we seemed to hit a crescendo of ocean damage on beaches and communities in Southern California. To really grasp what has been happening, we need to hit our Chat GPT link and look up “Kelvin Tides.” As if it isn’t enough that we are in the midst of a Super El Nino, we are experiencing a Kelvin Tide at the same time. So, to start this week’s note with something a bit more interesting than the financial markets, here is my take on the Kelvin Tide issue.
Newport Beach and to a more destructive extent, Southern Orange County and Long Beach, are experiencing a combination of both: a powerful, individual Kelvin wave pulse that is hitting the coast at this exact moment, a larger Kelvin Cycle Flow which is a direct symptom of a broader, developing "historic" El Niño cycle that will bring multiple waves over the coming months.
What we are witnessing on the coast right now is highly unusual and dangerous because three separate coastal hazards are converging at once:
- The Kelvin Wave: An El Nino fueled underwater surge has arrived on the Southern California coast, raising the background sea level by 11 inches above official NOAA tide predictions. This has effectively raised the baseline of the ocean.
- Tropical Storm Rachel Swells: Energy and powerful southerly swells from Post-Tropical Cyclone Rachel (which was a hurricane just days ago) are actively battering the shore.
- High Tides: Normal morning high tides are operating on top of that elevated Kelvin Wave baseline, pushing local high tides to over 7.5 feet.
Current Conditions & Closures in Newport Beach
Because the ocean is starting from such a high baseline, Newport Beach has experienced severe seawater flooding during this past weekend:
- Widespread Street Flooding: Seawater has flooded the Balboa Peninsula, submerging streets up to the medians across 15 to 20 blocks and stalling out vehicles.
- Emergency Beach Closures: City officials declared a local emergency, closing The Wedge, city beaches, and piers due to massive, unpredictable waves and breaching sand berms.
The really bizarro thing is that the Kelvin action is the result of the volume of water expanding. One would think how can water expand? Well, apparently, when water heats up it takes up more space. So, if the ocean is normally 66 degrees on average this time of year, and it is now 73-75, this is a massive difference, and it is causing the volume of water to expand and hence be reflected in much higher tidal flows.
Now back to our regularly scheduled financial message!
The S&P 500 limped into September month end with a “whimper” finishing the month essentially flat (down -0.4%). This is not the worst outcome given that incoming news for the month was “bad” and “worse” than expected.
- September “negative” developments weighing in on markets:
– Fed Chair Warsh became a “full blown hawk” and raised rates +25bp
– August jobs report was surprisingly strong with 162,000 jobs added = hawkish
– US 10Y completed a surge that took rates from 3.7% to 5.4%, in the last two months.
– US WTI oil hit $105 per barrel but for the month and ended up settling around $85.76 to $88.89, +3.6%
– September is a seasonally bad month in a midterm year - In spite of these negative developments and headwinds, the S&P 500 managed a better-than-expected outcome of flat. To us, this is a somewhat disappointing outcome given that market sentiment had been so negative and that markets had reached an oversold status earlier in the month.
- But to us, the bigger takeaway might be that despite these substantial headwinds, particularly the surge in yields. Bond yields rose to nearly 20-year highs, and these rates have been seen around the world.
- Why are yields are rising? There are several possible explanations:
– fiscal deficits could be creating credit risk issues.
– AI spending and borrowing is competing for debt markets.
– markets might see “long-term inflation” as higher.
– Fed might have signaled need to “crush” inflation sending cost of capital higher. - Who knows? And this is why markets were unsettled for the month. But again, we view the flat performance of equities as evidence that underlying equity fundamentals have been strong. That is, the stock market should have been far stronger in the month, if bond yields had not surged during the month.
- There are some positives that have developed as we exited September and moved into October:
– the gap between Core PCE (3.0% now) vs Core CPI (2.35% now) is narrowing. Decreasing inflation concerns.
– odds of a Fed hike in Oct dropped to 36% from >75% after Fed’s Warsh “hawkish declaration”
– WTI oil has been down trending for the past few weeks, after surging to $105
– US yields have risen for 7 months, and rarely in 75 years, manage to further rise beyond that
In taking all of this into consideration, I then want to go through the list of financial investment baskets available to determine what we might be seeing going forward. I will then finish with the cycle work that I believe should hold a preview of what we might expect going forward.
- Currencies: Clearly with US economic superiority and rising US rates, the US Dollar continues its strength vs. other foreign currencies. This is a great testament to the opinion of the US economy moving forward, but it is an unfortunate drag economically on our export capabilities. Biter sweet to be sure! But a true testament to how on fire our economy really is.
- Bonds: Without question bonds are a graveyard. Ever since interest rates topped out in 1984 there has been a very high degree of correlation between the performance of the US stock market and bond returns. The bond returns have been a combination of increase in market value added to the coupon returns of the bonds. For many years, in fact, the bonds actually outperformed the stocks even when stocks were having a really good year. Well, those times are over. THIS IS HUGELY IMPORTANT. Since bonds have for almost 50 years been a trade off or safe haven away from the volatility of equities, now they have had negative returns every year since COVID interest rate lows in 2020.
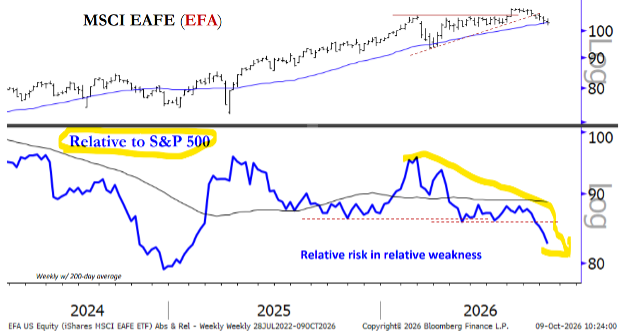
- International Stocks: Normally the international markets have been positive beneficiaries of US economic health and that has proven to be the case until just now. Now that the wars are in full swing and inflation is raising its head, the foreign markets are not showing the growth that normally occurs concurrently with the US markets. Here is the picture:
- US Stocks: The US markets have been very resilient, particularly after four years of dramatic performance. This can be attributed of late to the impact of infrastructure for the AI onslaught, but for the most part the economy has been fueled by the massive cash hoard that has been in place since the Great Financial Crisis and COVID. Until this benefit changes, nothing changes. Even during this very negative August / September seasonal period the markets vacillated sideways instead of experiencing a decline.
Where are we now?
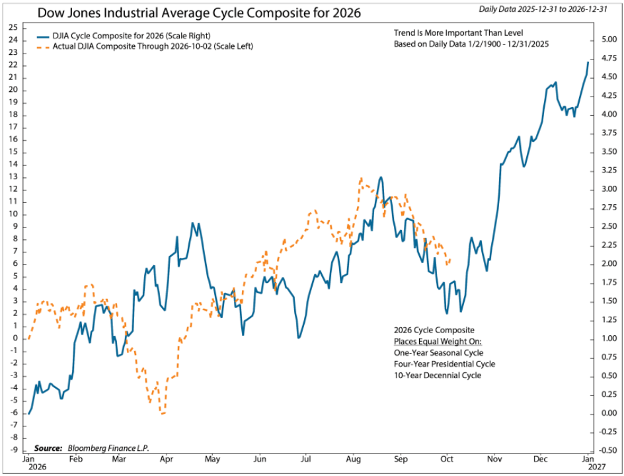
In closing, I wanted to go back to the cycle work from Ned Davis Research. I come back to this as these are factual and historical anomalies that are not related to politics, economies, or technological spikes. I find these very important as they have been consistent through many different periods. Here is the one for the Dow Jones Industrial Average. Since the Dow tends to be a smaller index that has been around the longest, and this year it has most closely resembled the cycle work, I am monitoring it closely. Note how it has shown a double bottom in the month of October. This could very well be what we experience due to the trepidation amongst all investors going into a highly contested midterm election period:
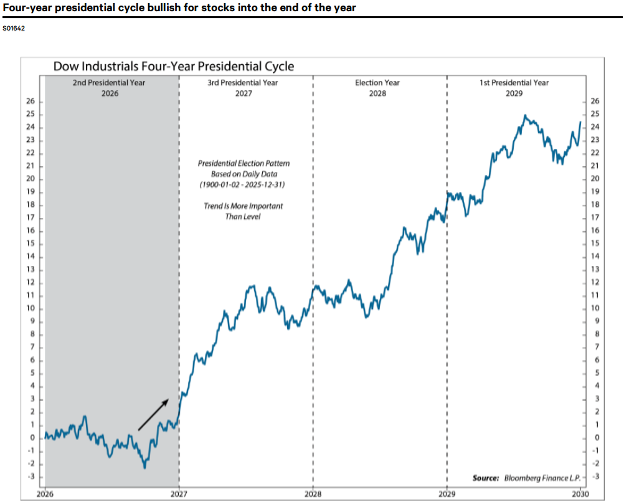
This brings me to my final point. This is the Four-year presidential cycle that uses this midterm year as the current year for point of reference. You can clearly see that after a terribly difficult period of back and forth for the 2nd Presidential Year, it has its final “puke out” in October- as seen above, and then it tends to be off to the races. In this illustration it is off to the races until 2029. We can only hope!
In closing, this week is the beginning of the earnings reports for the third quarter. Should they continue as they have been thus far in 2026 this could be the fuel need for Santa Claus to show up with bells on. Next week we will give greater attention to the earnings and forecasts. For now, the markets have been resting and should have a full tank of energy for the next move.
-Ken South, Tower 68 Financial Advisors, Newport Beach
Important Disclosures:
The opinions voiced in this material are for general information only and are not intended to provide specific advice or recommendations for any individual. To determine which investment(s) may be appropriate for you, consult your financial professional prior to investing. All performance referenced is historical and is no guarantee of future results. All indices are unmanaged and cannot be invested into directly.
Investing involves risks including possible loss of principal. No strategy assures success or protects against loss. There is no guarantee that a diversified portfolio will enhance overall returns or outperform a non-diversified portfolio. Diversification does not protect against market risk.
The Standard & Poor's 500 Index is a capitalization weighted index of 500 stocks designed to measure performance of the broad domestic economy through changes in the aggregate market value of 500 stocks representing all major industries. The S&P 500 is a stock market index tracking the stock performance of 500 of the largest companies listed on stock exchanges in the United States. Indexes are unmanaged and cannot be invested in directly.
The Dow Jones Industrial Average is comprised of 30 stocks that are major factors in their industries and widely held by individuals and institutional investors.
The Nasdaq-100 is a large-cap growth index. It includes 100 of the largest domestic and international non-financial companies listed on the Nasdaq Stock Market based on market capitalization.
The NASDAQ Composite Index measures all NASDAQ domestic and non-U.S. based common stocks listed on The NASDAQ Stock Market. The market value, the last sale price multiplied by total shares outstanding, is calculated throughout the trading day, and is related to the total value of the Index. Indexes are unmanaged and cannot be invested in directly.
The Russell 2000 Index is an unmanaged index generally representative of the 2,000 smallest companies in the Russell 3000 index, which represents approximately 10% of the total market capitalization of the Russell 3000 Index.
Data sourced from Bloomberg (2025).
Stock investing includes risks, including fluctuating prices and loss of principal. No strategy assures success or protects against loss. There is no guarantee that a diversified portfolio will enhance overall returns or outperform a non-diversified portfolio. Diversification does not protect against market risk.
Bonds are subject to market and interest rate risk if sold prior to maturity. Bond values will decline as interest rates rise. Bonds are subject to availability, change in price, call features and credit risk.
Government bonds are guaranteed by the US government as to the timely payment of principal and interest and, if held to maturity, offer a fixed rate of return and fixed principal value.
Bond yields are subject to change. Certain call or special redemption features may exist which could impact yield.
International investing involves special risks such as currency fluctuation and political instability and may not be suitable for all investors.
Alternative investments may not be suitable for all investors and should be considered as an investment for the risk capital portion of the investor’s portfolio. The strategies employed in the management of alternative investments may accelerate the velocity of potential losses.
This information is not intended to be a substitute for specific individualized tax advice. We suggest that you discuss your specific tax issues with a qualified tax advisor.
The economic forecasts set forth in this material may not develop as predicted and there can be no guarantee that strategies promoted will be successful.
The financial professionals with Tower 68 Financial Advisors are registered with, and securities and advisory services are offered through LPL Financial, a registered investment advisor. Member FINRA/SIPC.
LPL Tracking # 1191338