


On average, the weeks from around the 4th of July into August have been some of the best of the year. However, that has been bookended by some of the worst returns in June and then again during the August-October timeframe. As I always qualify, seasonality only provides a rough guide for what has occurred before, not some set-in-stone guarantee for the future. Yet so far this year the market has followed the general outline fairly well. The month of June has accordingly failed to inspire, and its final stretch has some of the worst historical seasonality over the past couple of decades.
The Straits of Hormuz are open…. or so we are told. Since this is the conflict de jour on the minds of the media, oil movement and oil prices are the reflection of this opening and the current state of the conflict. This brings us to then evaluate the course of equities in the aftermath and what could be expected in the second half of this midterm year. If we check off the major boxes, it sort of goes like this:
- Markets are in an uptrend or downtrend? Check.
- Economy is growing at a recognizable rate? Check.
- Labor, wages, and hiring is in an uptrend? Check.
- Risk assets like gold, silver and crypto are in declines signaling decreased US dollar tensions? Check.
- Interest rates as measured by the 10-year Treasury not signaling inflation? Check.
- Corporate finance being met with equity and debt consumption? Check.
In a nutshell, everything seems to be moving in the right direction and not in a parabolic pace (excluding semiconductor and memory sectors). So, the question that comes to my mind is what could be a black swan that could take away the proverbial punchbowl?
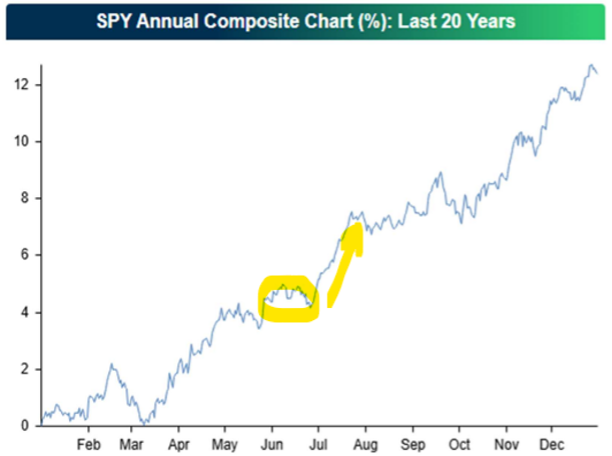
Slowdowns are normal and navigable as long as one understands the market we are in. Times like these are not when we are going to make our money. Being too active right now is like straining to squeeze the last few drops out of a desiccated lemon – the effort just isn't worth it. Performance has historically tended to pick up in July, although this is sometimes more of a slow grind higher rather than the kind of fireworks associated with the 4th here in the U.S. I took the time, with the help of Bespoke Investment Group, to put together the last 20 years of the market to see if we are following any typical market action. As can be seen below, this year has followed the typical quite well. If this is to continue, June is tough (the area I’ve circled), July is better (see the straight line at an angle), then the year could finish strong.
The expectation coming into this year was that President Trump would fill Powell's spot with some uber-dove puppet with a mandate to cut rates no matter what. Those concerns have largely faded in recent months, as inflation has become the top issue among the voting public and Warsh has mostly said the right things. So, the market will likely search for confirmation that the Fed is on the same page in today's meeting. The Fed meeting last week did throw a wrinkle into what has otherwise been a slower period. It is very rare these days for the Fed to surprise the market. This has been the case over the years, but it must be remembered that the markets don’t like what they don’t know or can’t handicap. Warsh’s comments and style fit this to a T. He definitely isn’t Powell, and he definitely isn’t President Trump’s dovish puppet either. Instead, as I have claimed a number of times, I believe the market typically leads the Fed and not the other way around. This is why, I believe that the market trembled a bit with Warsh’s comments as they were recognizably different in style from Powell’s, but then the next day got right back on its horse as the economy is clearly leading the markets higher.
In looking at the markets, I did a bit of an internal measurement of P/E’s (even though I find them to be one of the least important decision-making components) to get an idea of where the heat is coming from in the market performance and where it is being detracted. As expected, the value component continues to drag markets lower, and the momentum / growth component continues to lead. There are currently 84 stocks in the S&P 500 trading with TTM P/E ratios under 15. These names are down an average of 8.48% in 2026 and over the past week collectively fell 2.72% despite the S&P itself gaining ground. Conversely, there are 184 stocks in the index with TTM P/E ratios over 30. These are up 29.94% YTD, on average, and tacked on 1.49% in the past week. Price-to-earnings is an imperfect metric, of course, and does not tell the entire story, but it is an easy shorthand that shows that "value" has largely been a value trap.
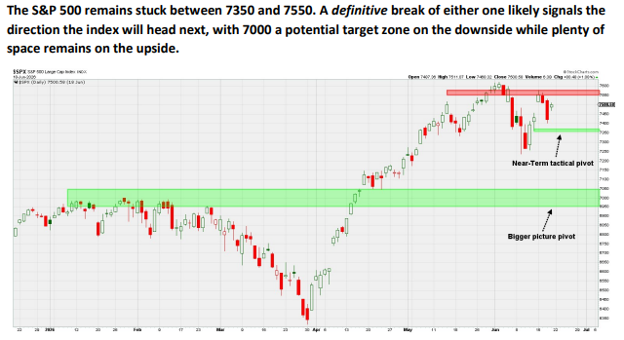
To sum up, the market appears to be at an important decision point here despite this being the beginning of the dog days of the summer. The Fed meeting added an extra element of uncertainty, but we have our parameters: ~7350 as key near-term support and 7550 as key near-term resistance. See the chart below:
In the rest of this note will attempt to walk through macro, technical, and sentiment indicators we are watching to determine whether the rebound is part of a sustainable rally deep into the third quarter or the final burst into a topping process.
How much will oil decline?
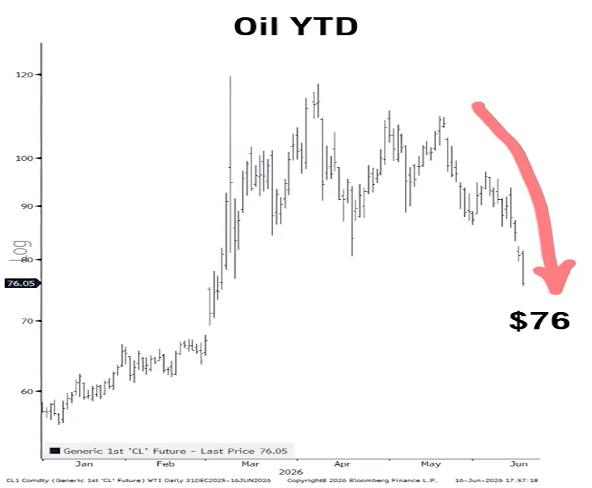
At the beginning of the conflict, most commodity strategists predicted oil prices would have been much higher if the Strait had remained closed for 3.5 months. US oil futures' 15% drop from its May 15 high to June 12 reflects expectations of an eventual reopening as well as the global supply chain being more flexible than anticipated. This supports Trumps actions in Venezuela and his “drill baby drill” objectives.
Even after last Monday’s drop, futures are 16% above where they closed on February 27. More confidence in a lasting peace could turn the six-month price momentum negative later this summer. When this has happened, historically, the S&P 500 has risen at an 18.5% annual rate, on average. Energy prices have been the main culprit for our headline inflation indicator turning bearish in April. A reversal could push the CPI below its six-month average, reestablishing the disinflation that has defined the cyclical bull market that started in late 2022.
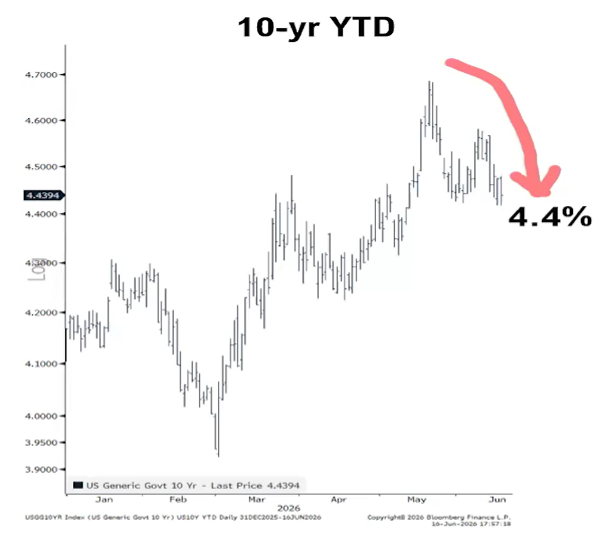
Since January, the Fed fund futures have swung from pricing in rate cuts to now pricing in rate hikes. A more benign inflation outlook (due to these declining oil prices) could remove the near-term risk of a fed funds rate increase and bring back the possibility of lower short-term rates before the end of the year, which have been bullish for stocks. Interest rates going higher have tended to take the air out of the balloon for an advancing market. This tends to be the immediate effect, yet upon further investigation it then becomes, “It’s the economy stupid.” If the economy continues to flourish then valuation calculations could plot a course for further price advancement. Here is the recent action of the 10-year Treasury:
In examining the importance of oil and its price, it forced us to pay specific attention to retail sales last week as gasoline often in the culprit that can suck the oxygen out of the room for the retail consumer. If gas is high, there isn’t enough extra discretionary money to facilitate retail purchases. Retail sales rose 0.9 % in May, beating consensus expectations. Retail sales are up 6.9% versus a year ago. Sales excluding autos rose 0.8% in May (+0.9% including revisions to prior months), beating consensus expectations. These sales are up 7.5% in the past year. The largest increases in May were for gas stations, non-store (brick and mortar) retailers (internet and mail-order), and autos. The biggest decline was for restaurants and bars. The resiliency of the US consumer was on display once again in May as retail sales beat consensus expectations and rose 0.9% for the month. That said, the recent peace agreement between the U.S. and Iran should help alleviate some of the strain on consumers through lower energy prices sometime in the second half of this year.
Will falling oil prices lift equity sentiment?
Economic pessimism With the economy near full employment and the stock market at record highs, one might find the record low reading in the Reuters/University of Michigan Consumer Expectations Survey surprising. The UofM survey is skewed toward lower income households and has been sensitive to gasoline prices. In contrast, the Conference Board’s survey is near the middle of its historical range. Like other sentiment gauges, the UofM sentiment index has been a contrarian indicator for the stock market. When the six-month change has been negative, the S&P has risen at a 13% annual rate (chart). A rebound in consumer expectations would be bullish for stocks unless/until it triggers a sharp jump in sentiment that pulls investors off the sidelines.
AAII survey Turning to investor sentiment, the American Association of Individual Investors (AAII) survey is showing a net of 44% bulls over the past three weeks, putting it in a zone where the S&P 500 has risen at an 11% annual rate (chart). Respondents to AAII have not believed in the current bull market. Since the cyclical bull started in 2022, they have been pessimistic 72% of the time. A drop in oil prices may not be enough to pull this cautious group off the sidelines, but if it did, it would be a notable change versus the majority of this bull market.
So, if there is continuous economic pessimism and this is reflected in the AAII surveys, it begs the question if all of the good from economic prosperity is currently reflected in the markets. This is why I went to the first picture in this week’s note. What has generally been happening, every year, for the last 20, on average. So far so good! But let’s play the devil’s advocate for a moment.
Breadth watch
As I brought up numerous times throughout this year, breadth (a signal of broadening strength) has been missing. A consequence of the lack of dispersion is that breadth has been less extreme. Traditionally, advancing volume 10 times declining volume is considered a big upside day (better known as a ‘breadth thrust’), and vice versa. Last year there were six 10:1 down days and three 10:1 up days. Year to date, there have been none. The biggest upside day was 5.9:1 on March 31. The worst was a 4.9:1 down day on March 12.
The Iran news did not flip the script. Monday following the cease fire, was less than a 2:1 up day. The Energy sector slumped 3.6%, which is not surprising given the drop in crude. Three other low-beta S&P 500 sectors also declined on Monday: Consumer Staples, Health Care, and Real Estate sectors. Even the Russell 2000 Value, which should have benefited from lower interest rates, slipped 0.2%.
When is the good news priced in?
Despite the consensus view that the Strait would eventually be reopened, uncertainty around the timing prevented media related prognosticators from becoming too optimistic. I keep stressing “media related” as various poles, newspapers, and CNBS, tend to reflect opinions of those that are considered liberal media based and Trump haters more specifically. Hence, there is virtually nothing written about how good the economy and the US stock market is. Instead,, how bad things are and how we are destined for destruction if things are allowed to continue as they are under the current administration. Many daily trading sentiment indicators had fallen to a low / neutral reading on June 11 before jumping on Monday. How quickly sentiment returns to its optimistic zone may determine if the rebound lasts deep into the third quarter.
At this point, we only have historical data to work from to have any kind of forecasting confidence. According to the folks at FundStrat Direct, this advance could carry us into late July or August but then we could be prepared for some level of market contraction. The reasons for the contraction I have not been able to really recognize other than the history of midterm markets and such.
-Ken South, Tower 68 Financial Advisors, Newport Beach
-
Get Ken's Weekly Market Commentary Delivered To Your Inbox!
Important Disclosures:
The opinions voiced in this material are for general information only and are not intended to provide specific advice or recommendations for any individual. To determine which investment(s) may be appropriate for you, consult your financial professional prior to investing. All performance referenced is historical and is no guarantee of future results. All indices are unmanaged and cannot be invested into directly.
All information is believed to be from reliable sources; however LPL Financial makes no representation as to its completeness or accuracy.
Investing involves risks including possible loss of principal.
The Standard & Poor's 500 Index is a capitalization weighted index of 500 stocks designed to measure performance of the broad domestic economy through changes in the aggregate market value of 500 stocks representing all major industries. The S&P 500 is a stock market index tracking the stock performance of 500 of the largest companies listed on stock exchanges in the United States. Indexes are unmanaged and cannot be invested in directly.
The Dow Jones Industrial Average is comprised of 30 stocks that are major factors in their industries and widely held by individuals and institutional investors.
The Nasdaq-100 is a large-cap growth index. It includes 100 of the largest domestic and international non-financial companies listed on the Nasdaq Stock Market based on market capitalization.
The NASDAQ Composite Index measures all NASDAQ domestic and non-U.S. based common stocks listed on The NASDAQ Stock Market. The market value, the last sale price multiplied by total shares outstanding, is calculated throughout the trading day, and is related to the total value of the Index. Indexes are unmanaged and cannot be invested in directly.
The Russell 2000 Index is an unmanaged index generally representative of the 2,000 smallest companies in the Russell 3000 index, which represents approximately 10% of the total market capitalization of the Russell 3000 Index.
Data sourced from Bloomberg (2025).
Stock investing includes risks, including fluctuating prices and loss of principal.
Bonds are subject to market and interest rate risk if sold prior to maturity. Bond values will decline as interest rates rise. Bonds are subject to availability, change in price, call features and credit risk.
Government bonds are guaranteed by the US government as to the timely payment of principal and interest and, if held to maturity, offer a fixed rate of return and fixed principal value.
Bond yields are subject to change. Certain call or special redemption features may exist which could impact yield.
International investing involves special risks such as currency fluctuation and political instability and may not be suitable for all investors.
Alternative investments may not be suitable for all investors and should be considered as an investment for the risk capital portion of the investor’s portfolio. The strategies employed in the management of alternative investments may accelerate the velocity of potential losses.
This information is not intended to be a substitute for specific individualized tax advice. We suggest that you discuss your specific tax issues with a qualified tax advisor.
The economic forecasts set forth in this material may not develop as predicted and there can be no guarantee that strategies promoted will be successful.
The financial professionals with Tower 68 Financial Advisors are registered with, and securities and advisory services are offered through LPL Financial, a registered investment advisor. Member FINRA/SIPC.
LPL Tracking # 1128930