


With Q4 commencing, here are a few things we’re thinking...in no particular order. I say this with a high degree of trepidation given the unlimited pounding of the pavement by media prognosticators talking about the midterms, the war, oil, and the financial markets.
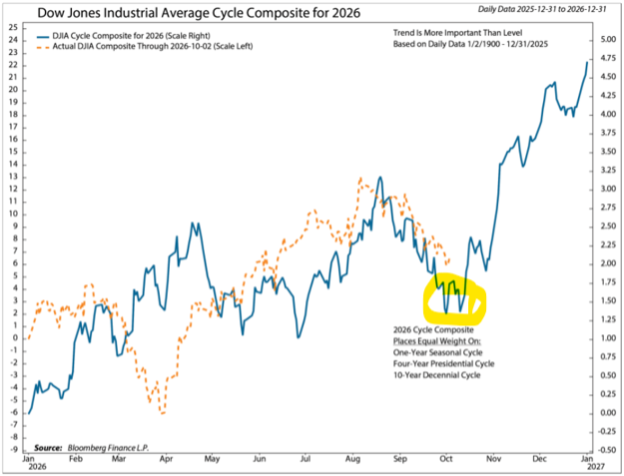
Seasonals turn very supportive around now. As I have been showing in my seasonal cycle studies, markets tend to trade sideways for much of the summer in midterm election years and begin to bottom and then rally into the start of November. According to Larry Williams, the exact day that statistics show as being a possible day to deploy capital is actually two trading days prior to the voting day of November 3rd. This is on the Friday just prior. I am not saying this as a recommendation in any way but just want to be on record as reflecting comments of a sage of the markets.
A key theme to contemplate in all of this: Interest rates are certainly a headwind. But profits are an even bigger tailwind.
Yes, the 10-year is tickling 5.40%. And this is the scariest since it affects corporate lending, US Government debt service costs, and mortgage financing.
- But analysts expect Q3 earnings to come in at +27% vs a year ago.
- Yes, a deceleration but still an absolute monster of a number.
- And as we’ve repeatedly stated, the US economy is less interest rate sensitive than we’ve historically accepted.
- Sure, there are still some segments of the economy that are rate sensitive:
- Small caps, homebuilders, utilities, REITS, etc.
- But tech and the AI trade will just keep humming along.
- When the attitude in the AI race is that second place is for losers, an incremental 50bps in borrowing costs isn’t likely to slow things down.
But let’s reflect on the inflation readings- the drivers of inflation in many cases:
Retail Sales for the month of September:
Flashy headline, modest details. Retail sales rose 0.8% in September, easily beating consensus expectations, while sales in previous months were revised higher. However, most of the surprise can be attributed to a 6.4% jump in gas stations sales, reflecting higher prices at the pump, not a boost to economic activity. Still, growth was broad-based with eight of thirteen major sales categories rising in September. sales at restaurant and bars – the only glimpse we get at services in this report – increased 1.1% in September following an upwardly revised +1.4% gain in August. Sales in this category have shown solid growth since February and stand 7.0% higher than a year ago, outpacing the 6.3% increase for overall sales.
Producer Price Index:
Producer prices surged in September, rising across the board. The Producer Price Index rose 1.3%, the largest monthly gain since 2022. While more than 40% of the headline increase was due to energy (which rose 10.8% for the month), final demand prices excluding energy also rose 0.7% in September, as the second-order effects of higher energy prices work their way through the economy. Gasoline prices jumped 20.3% in September and are up 64.3% in the past year. Further back in the supply chain, price increases for intermediate goods were broad-based, with elevated energy prices continuing to burden businesses at every stage of production.
If all of this is true, and it must be as these are unbiased numbers based on consistent statistical data, why would interest rates fall precipitously immediately following the PPI release last Thursday? I believe that is again a reflection of the importance of energy even in a new world of AI. Lower-income households spend a smaller absolute dollar amount on gas than higher-income households, but it consumes a significantly larger percentage of their total income or budget. This tends to be in the area of 3-6% of their monthly income on energy related products like gasoline and heating oil.
So, if the conflicts in the Middle East were to calm then oil prices and gasoline prices should pull back. I believe that the situation with interest rates is a bit more related to the overall level of debt in the global systems and if the debt levels are high then rates should reflect this. Here is what we are seeing:
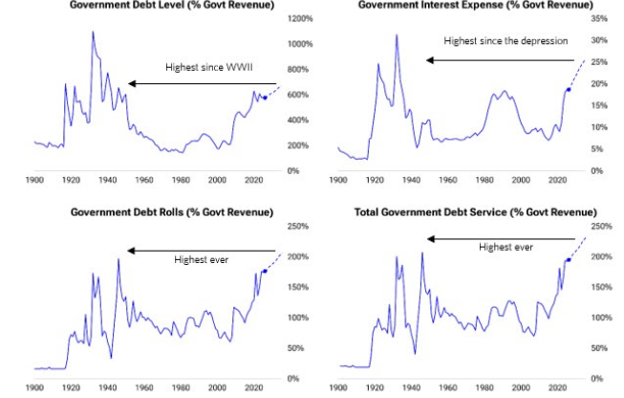
Favoring global liquidity, the government’s debt level, maturing debts, interest payments, and total debt service payments stand at record levels today and trending higher over the next couple of years. The debt burdens are at their highest level since WWII and are expected to worsen. I am OK with the fact that the debt as a percentage of revenues is at a cyclical point, but what I am not happy with is that the overall level of debt keeps on rising. The root of the argument in this year’s Midterms is in regard to increasing spending on social programs yet no comments on how to rain in frivolous programs that continue to gain more funds. This is an argument for another time!
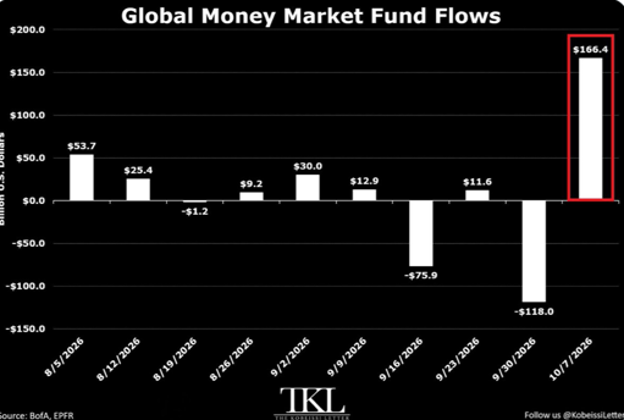
Global money market funds attracted +$166.4 billion in inflows in the week ending October 7th, their largest weekly inflow since April 2020 (the post COVID Government helicopter drop). US money market funds alone posted +$72.3 billion in inflows, lifting their total assets to a record $8 Trillion.
Since 2023, US money market fund assets have risen +$3 Trillion. Investors are piling into risk-free investments as rates surge.
Back to our normally scheduled programing- the US Equity markets:
The market is under clear pressure. Distribution has shown up in the Nasdaq and leading growth names, inflation data has rekindled rate-hike odds, and the AI complex is no longer getting an automatic free pass. South Korea’s KOSPI just delivered the clearest illustration: it crashed more than 7% in a single session, triggered a circuit breaker, and extended a multi-day rout that has wiped out a large chunk of its recent gains. Samsung Electronics and SK Hynix, the purest large-cap expressions of the HBM/DRAM boom, fell roughly 9-11%. Foreign selling has been relentless. When the memory leaders that have been the global supply bottleneck for AI accelerators are being liquidated this hard, it is not background noise. When this occurs, initially, investors see it as a simple correction / digestion. As it progresses and extends in time investors begin to question whether they are not seeing things clearly and fear begins to set in. This is where we are currently.
Historically, strong earnings from the true leaders can reverse a corrective phase—if the market is still in a general uptrend and the selling has been selective. Right now, the backdrop is more fragile. The KOSPI action is not an isolated emerging-market event; it is a high-beta read on the same HBM and advanced packaging demand that has underpinned the entire AI capital-spending story. When those stocks gap down on heavy volume and fail to find support, it raises the bar for what U.S. hyperscaler, and chip earnings must deliver. Guidance on capex, memory commitments, and forward order visibility will matter far more than the headline beats. Price and volume remain the final arbiters. The coming earnings reports will either reassert institutional demand in the leaders or confirm that the recent Korean and U.S. semiconductor selling suggests deeper re-pricing. Watch how leading stocks react, not the headline numbers. The market will tell you which is which.
The most recent factoid was the earnings report from ASM Lithography, the European company that has a virtual monopoly in making the machine that make the chips. They announced earnings last week. They beat the most recent expectation and said that they expect to grow approximately 30% in both 2027 & 2028. What was most interesting was their comment that they would could grow even much more than this IF they had the capability to make more! This tells us that the bottleneck is still alive and well and could well extend for many years to come.
Back to Midterms:
Gridlock after the midterms is not, by itself, bearish. A divided Congress is usually neutral to mildly constructive for stocks, because the big swings in tax policy, regulation, and spending get harder to pass. What the market actually discounts into November is unresolved uncertainty: who controls the committees, and what can still get through. Once the seats are known, that range narrows. Wall Street has lived with gridlock for decades for that reason. Hence the study mentioned above by the legendary Larry Williams.
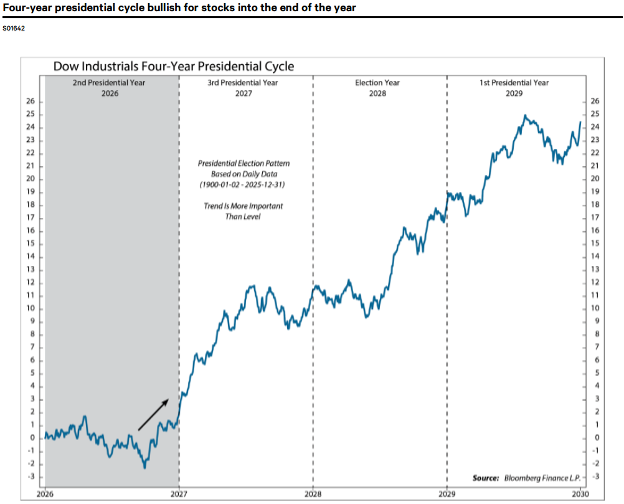
The seasonal record is a real average, not a buy signal. Since 1950, midterm years have often been choppy into the fall (where we are today, things are right on schedule), then stronger in the fourth quarter. Here is the Four-Year Presidential Cycle Chart that I showed last week. As can be seen, we are right where I have circled on the chart:
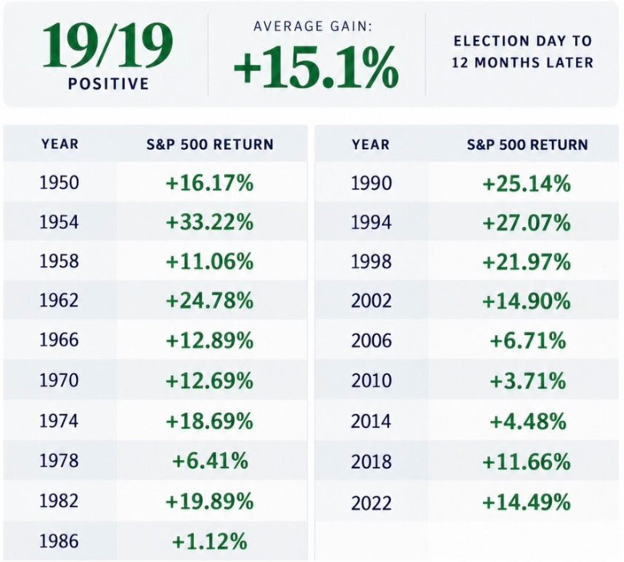
FactSet data compiled puts the average Q4 gain in a midterm year at 6.6%, nearly double the next-strongest year in the presidential cycle. Silvia Insights has the following year, year three of the cycle, as the strongest of the four, with a 17.2% average annual return, more than double the post-election year. Over seven decades the S&P 500 has also averaged a 31.8% gain from its midterm-year low. The sample is about 18 midterms, and the average hides years that did not rally. Interesting fact: Since 1942, every November-to-June period following a midterm has been positive for the S&P 500. 21/21. Average: +16.6%. That’s a 100%-win rate. Here is the chart from the Gilmo Group. This shows the statistical numbers going back to 1950.
In closing, I truly recognize how volatility in the markets at the same time as the political arena is its most frictional is no fun! But, in looking at the different places assets can be deployed, the US Equity market still stands as the leader. At the same time, things could continue to be a bit saucy going into November 3rd voting day.
Just remember to have your sights set on history and the final chart of what has happened on the Four-year Presidential cycle going all the back to January of the year 1900:
-Ken South, Tower 68 Financial Advisors, Newport Beach
Important Disclosures:
The opinions voiced in this material are for general information only and are not intended to provide specific advice or recommendations for any individual. To determine which investment(s) may be appropriate for you, consult your financial professional prior to investing. All performance referenced is historical and is no guarantee of future results. All indices are unmanaged and cannot be invested into directly.
Investing involves risks including possible loss of principal. No strategy assures success or protects against loss. There is no guarantee that a diversified portfolio will enhance overall returns or outperform a non-diversified portfolio. Diversification does not protect against market risk.
The Standard & Poor's 500 Index is a capitalization weighted index of 500 stocks designed to measure performance of the broad domestic economy through changes in the aggregate market value of 500 stocks representing all major industries. The S&P 500 is a stock market index tracking the stock performance of 500 of the largest companies listed on stock exchanges in the United States. Indexes are unmanaged and cannot be invested in directly.
The Dow Jones Industrial Average is comprised of 30 stocks that are major factors in their industries and widely held by individuals and institutional investors.
The Nasdaq-100 is a large-cap growth index. It includes 100 of the largest domestic and international non-financial companies listed on the Nasdaq Stock Market based on market capitalization.
The NASDAQ Composite Index measures all NASDAQ domestic and non-U.S. based common stocks listed on The NASDAQ Stock Market. The market value, the last sale price multiplied by total shares outstanding, is calculated throughout the trading day, and is related to the total value of the Index. Indexes are unmanaged and cannot be invested in directly.
The Russell 2000 Index is an unmanaged index generally representative of the 2,000 smallest companies in the Russell 3000 index, which represents approximately 10% of the total market capitalization of the Russell 3000 Index.
Data sourced from Bloomberg (2025).
Stock investing includes risks, including fluctuating prices and loss of principal. No strategy assures success or protects against loss. There is no guarantee that a diversified portfolio will enhance overall returns or outperform a non-diversified portfolio. Diversification does not protect against market risk.
Bonds are subject to market and interest rate risk if sold prior to maturity. Bond values will decline as interest rates rise. Bonds are subject to availability, change in price, call features and credit risk.
Government bonds are guaranteed by the US government as to the timely payment of principal and interest and, if held to maturity, offer a fixed rate of return and fixed principal value.
Bond yields are subject to change. Certain call or special redemption features may exist which could impact yield.
International investing involves special risks such as currency fluctuation and political instability and may not be suitable for all investors.
Alternative investments may not be suitable for all investors and should be considered as an investment for the risk capital portion of the investor’s portfolio. The strategies employed in the management of alternative investments may accelerate the velocity of potential losses.
This information is not intended to be a substitute for specific individualized tax advice. We suggest that you discuss your specific tax issues with a qualified tax advisor.
The economic forecasts set forth in this material may not develop as predicted and there can be no guarantee that strategies promoted will be successful.
The financial professionals with Tower 68 Financial Advisors are registered with, and securities and advisory services are offered through LPL Financial, a registered investment advisor. Member FINRA/SIPC.
LPL Tracking # 1194940