


Many things happened last week. Most of which sort of went on under the hood, but all of them were quite important. I will be going through each of them this week to make sure that the landscape is understood by you so that you can be somewhat prepared for the action of the markets going into the Midterms.
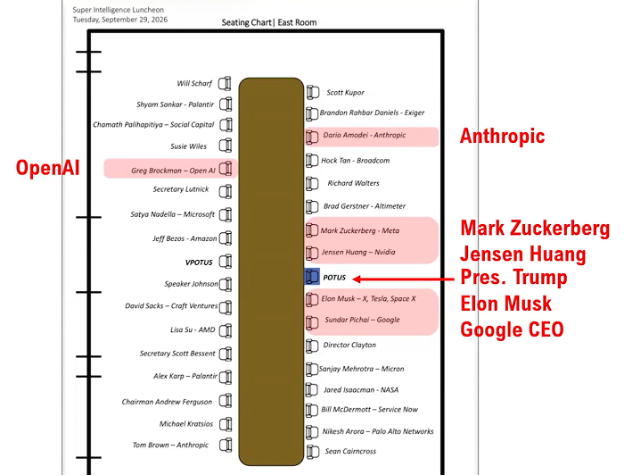
The first point I wanted to address was the luncheon that went on at the White House last week. I find it very frustrating that the news media did little to report on the action taken by the President and the major technology leaders of the world last week. Trump basically called a meeting and said, “Hey Guys, we need to do something about this safety issue around AI. I’m not here to tell you what to do, I am here to say that if we truly intend to continue our global leadership, safeguards must be put in place to protect everyone.” What I found astounding was the list of those in attendance. Here is the layout of the table for the lunch. I believe this is a gathering of the smartest business leaders on the planet today. I find this dramatically more valuable and important that a grouping of political leaders, many of which have questionable political biases behind them and limited knowledge on the cutting edge of an ever-evolving technology that is sure to direct the direction of the world.
The next point about last week was the action of the US equity markets in general. As I have been stating week in and week out, August and September are historically difficult months and this year proved to be consistent with history. So much so in fact that I made it a point to provide the cyclical backdrop last week of what the market have done on a one-year, four-year, and ten-year basis so that it could be seen quite clearly what is the “normal” occurrence even at a time of abnormal events. Needless to say, many times throughout history there have been abnormal events, but today everyone on the planet is provided an analysis of every hair follicle on the head of every beast in the world today!
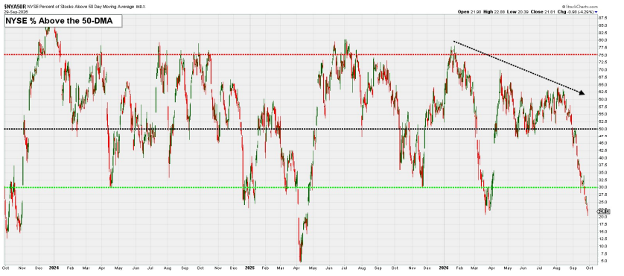
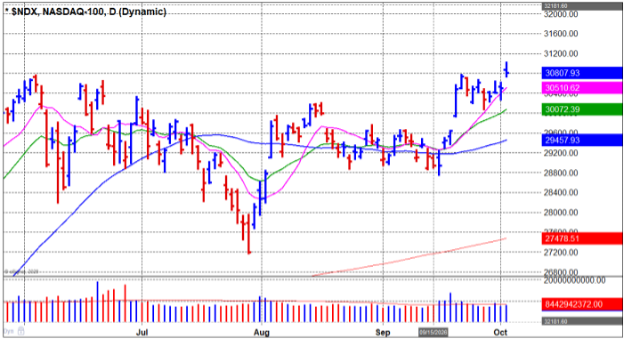
We are in a historic time where the US equity markets are hitting all-time highs in the instance of the tech-heavy NASDAQ 100, within 2% of all-time highs in the case of the S&P 500. The reason why this is historic is that at the same instant, companies are trading dreadfully lower based on their short-term relative price measures. On September 25, the S&P 500 Index closed 0.7% below its August 13 record high. The percentage of NYSE stocks above their 50-day moving average dropped to just above 20% earlier today. That is now worse than where it bottomed in March, when the S&P 500 was down 10%. It is also the weakest reading going back to late 2023 outside of the Liberation Day tariff selloff in the spring of 2025. That marked the first time since the Multi-Cap dataset started in 1981 that the S&P 500 was within 1% of an all-time high, less than 25% of stocks were above their 50-day, and less than 45% were above their 200-day. While a first-time event is noteworthy, the issue we are all faced with is that it is impossible to examine previous cycles, as there are none! Here is exactly where we are. Note on the far right is where we are, the next low to the left is when the war with Iran started and the next one was when tariffs were announced.
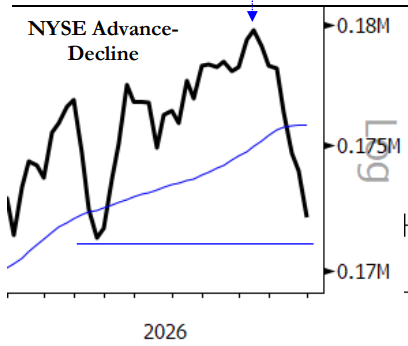
A more graphic picture is the action of the markets as compared to the number of advancing issues vs. number of declining issues. This is the most confusing issue for the majority of investors. How could the NASDAQ be at all-time highs yet daily individual companies are just flaming out? This is a further reflection of the need to be in the right places.
So, the next logical question would be, “how could this be happening?” Well, I believe it is a function of the historic even of AI inertia.
According to the Kobeissi Letter:
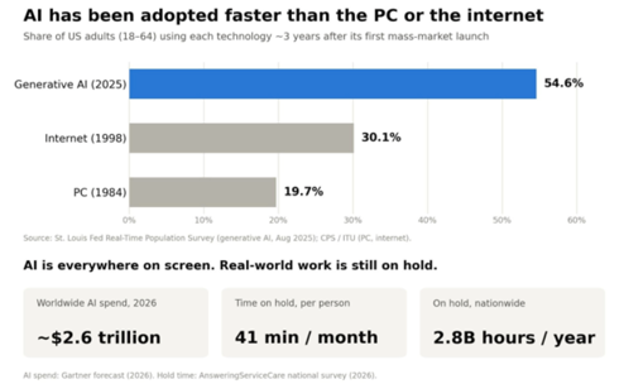
AI has been adopted faster than any other technology in history. In roughly 4 years, AI went from an idea to a product that more than 1.2 billion people have already used. In the US alone, 1 in 4 adults now interact with AI every day. Here is a graphic that illustrates how truly monumental it is. In 1984 it was the launch of the PC (personal computer), in 1998 it was the opening of the internet, today Generative AI:
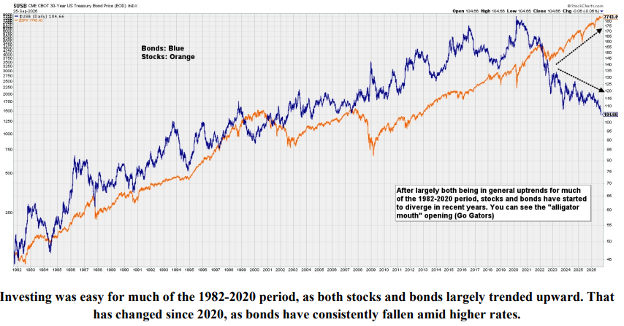
The next point to address is the interest rate market. Forget for a moment “why” interest rates are higher but instead focus on the action itself. I will be addressing the why later. What is vastly important is that this has changed the complexion of bonds in general and most specifically the fact that due to their action over the last 6 years that they are a detriment to a portfolio rather than a diversifier from stocks or a place to hide if the stock markets of the world get volatile. Here is exactly how bonds have acted since 1980. Now, before you look at this, think about it. Where were you and what were you and your parents and grandparents worth back then. This is a measure in your personal eternity.
I have often spoken of a fact that is seldom if ever touched upon. The US Fed and central governments throughout the world helicopter dropped Trillions on their economies to rescue them from disaster during the Great Financial Crisis and then even more dramatically at the global shut down at the onset of COVID. This is how much cash is sloshing around as of June of this year:
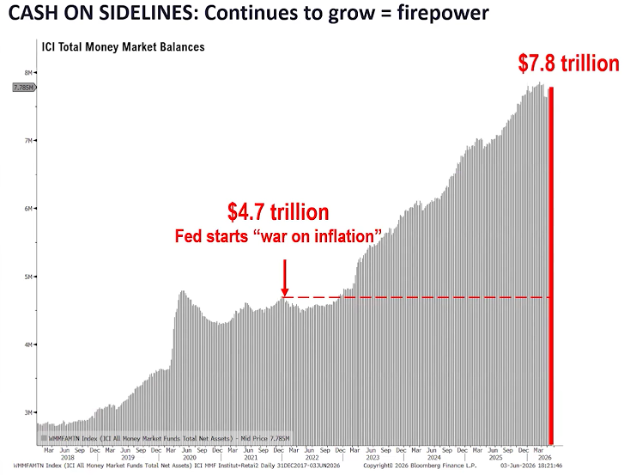
Is it any wonder why there is inflation and interest rates are going up? Although it rescued the world from terrible political decisions across the globe, the repercussions are now being felt. How we come out of this will depend, I believe, to a great extent on the way the world benefits from and manages the positive effects of AI on all facets of industry, labor, and wages.
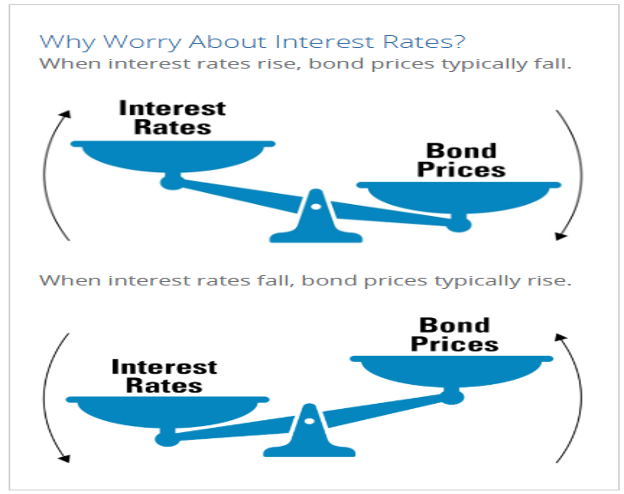
Back to bond in general for a moment. Bonds are really a very simple thing to understand. Below is a picture that I have saved for over 30 years. It is the best way that I can describe how bonds act when interest rates move. Look at the picture above that shows what has happened to the cumulative return on bonds relative to the stock market since the drop of cash during COVID. Disaster!!!! Now, look at the picture below. Please tattoo this picture on your brain.
Bonds have been an undisputed disappointment. The 10-Year note finished lower in three of the five years from 2021 through 2025 and is on pace to do so again this year. That stretch includes 2022, which was the worst year since the Depression era for a portfolio like the popular 60% stock/40% bond mix that served investors so well for so long. The lackluster returns since 2020 support my view that the long-term bond bull market is over and a secular bear market has commenced until proven otherwise. Not surprisingly, that has many investors rethinking the dominant role long-term bonds played in so many modern portfolios. The problem is not just weaker returns. It is that the core assumption behind the 60/40 — that bonds will rally when stocks fall — has become unreliable in an environment where inflation and rising rates can hit both at the same time.
Long-term bonds are now hitting true extremes as well. TLT is more than three standard deviations below its 50-day moving average, and its daily RSI is the most oversold since October 2023.
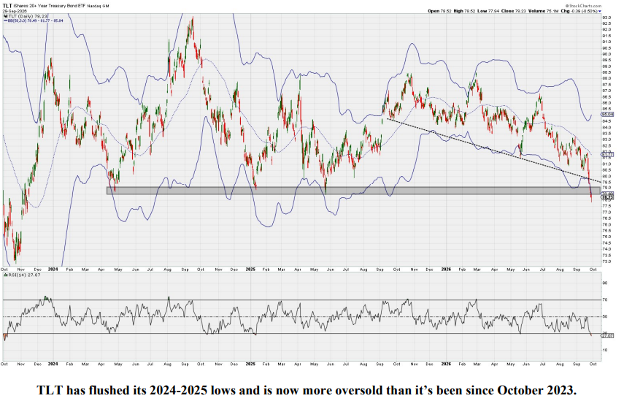
The general market remains oversold thanks to what has largely been a stealth correction. With only 26% of NYSE stocks above their 50-day moving average as of Friday, and the average S&P 500 stock sitting around 20% beneath its 52-week high, conditions are about as bad as they usually get outside of the high-profile selloffs everyone tends to remember. That continues to offer the market an escape hatch, since even marginal improvement should be enough to carry the S&P 500 to new highs. For now, though, the weakness persists outside of a handful of leading groups.
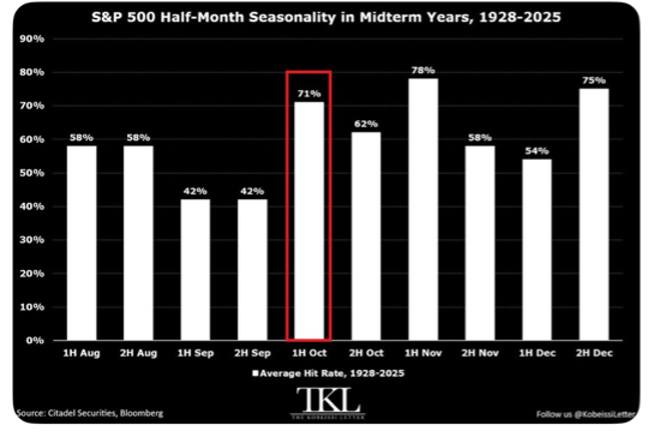
According to The Kobeissi Letter, history TODAY points to stronger equity returns ahead: Since 1928, the S&P 500 has risen +2.1% on average during the first half of October in US Midterm election years, making it the strongest performing half-month of Q3. Over this period, positive returns occurred 71% of the time, the third best hit rate of the last quarter of the year. This follows a historically weak second half of September, which has seen a -1.1% decline on average.
Historically, November has historically been even stronger, with the first half averaging a +1.7% return and posting positive returns 79% of the time. Seasonality is turning more favorable for stocks!
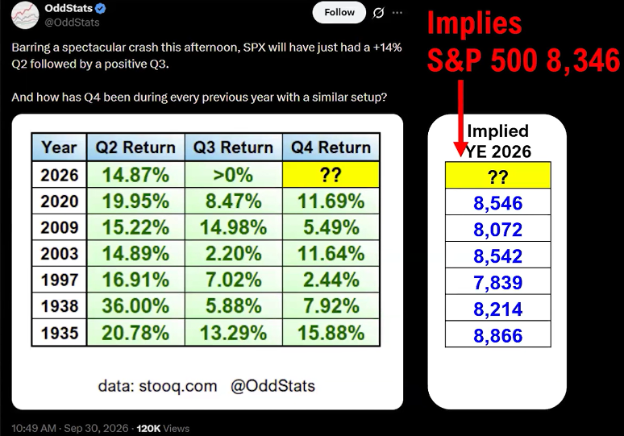
The last statistic I am going to leave you with is this from Thomas Lee of FundStrat Direct. If Q2 is up over 10%, and Q3 is at all positive, six out of six times Q4 has been positive and positive in a strong fashion. If we even get a hint of this, it could be a great Christmas!
-Ken South, Tower 68 Financial Advisors, Newport Beach
Important Disclosures:
The opinions voiced in this material are for general information only and are not intended to provide specific advice or recommendations for any individual. To determine which investment(s) may be appropriate for you, consult your financial professional prior to investing. All performance referenced is historical and is no guarantee of future results. All indices are unmanaged and cannot be invested into directly.
Investing involves risks including possible loss of principal. No strategy assures success or protects against loss. There is no guarantee that a diversified portfolio will enhance overall returns or outperform a non-diversified portfolio. Diversification does not protect against market risk.
The Standard & Poor's 500 Index is a capitalization weighted index of 500 stocks designed to measure performance of the broad domestic economy through changes in the aggregate market value of 500 stocks representing all major industries. The S&P 500 is a stock market index tracking the stock performance of 500 of the largest companies listed on stock exchanges in the United States. Indexes are unmanaged and cannot be invested in directly.
The Dow Jones Industrial Average is comprised of 30 stocks that are major factors in their industries and widely held by individuals and institutional investors.
The Nasdaq-100 is a large-cap growth index. It includes 100 of the largest domestic and international non-financial companies listed on the Nasdaq Stock Market based on market capitalization.
The NASDAQ Composite Index measures all NASDAQ domestic and non-U.S. based common stocks listed on The NASDAQ Stock Market. The market value, the last sale price multiplied by total shares outstanding, is calculated throughout the trading day, and is related to the total value of the Index. Indexes are unmanaged and cannot be invested in directly.
The Russell 2000 Index is an unmanaged index generally representative of the 2,000 smallest companies in the Russell 3000 index, which represents approximately 10% of the total market capitalization of the Russell 3000 Index.
Data sourced from Bloomberg (2025).
Stock investing includes risks, including fluctuating prices and loss of principal. No strategy assures success or protects against loss. There is no guarantee that a diversified portfolio will enhance overall returns or outperform a non-diversified portfolio. Diversification does not protect against market risk.
Bonds are subject to market and interest rate risk if sold prior to maturity. Bond values will decline as interest rates rise. Bonds are subject to availability, change in price, call features and credit risk.
Government bonds are guaranteed by the US government as to the timely payment of principal and interest and, if held to maturity, offer a fixed rate of return and fixed principal value.
Bond yields are subject to change. Certain call or special redemption features may exist which could impact yield.
International investing involves special risks such as currency fluctuation and political instability and may not be suitable for all investors.
Alternative investments may not be suitable for all investors and should be considered as an investment for the risk capital portion of the investor’s portfolio. The strategies employed in the management of alternative investments may accelerate the velocity of potential losses.
This information is not intended to be a substitute for specific individualized tax advice. We suggest that you discuss your specific tax issues with a qualified tax advisor.
The economic forecasts set forth in this material may not develop as predicted and there can be no guarantee that strategies promoted will be successful.
The financial professionals with Tower 68 Financial Advisors are registered with, and securities and advisory services are offered through LPL Financial, a registered investment advisor. Member FINRA/SIPC.
LPL Tracking # 1187391