

Friday was a bad day in the stock market. It stood out even more given the complete lack of downside we've enjoyed over the past couple of months. I have been warning that some kind of digestion was due, I clearly didn’t expect it in a single trading day! The NASDAQ 100 fell over 4%, the Russell 2000 dropped more than 3%, and even the large-cap S&P 500 gave back more in one session than it had at any point during the rally coming into this past week. By the time the closing bell rang, an estimated $1.8 trillion in market cap had been wiped out in the blink of an eye. And yet, I can still make an argument that the session was consistent with what I wrote last week. It was a bad session but not as bad as you would assume given those heavy losses in the indices. Almost 40% of NYSE operating stocks still advanced, so it wasn't even close to an 80% downside day. Even within the collapsing NASDAQ 100, 31 stocks gained ground. I believe this is a further testament to the narrow group of leaders truly dragging the indexes around. Days like Friday are simply what happens when 10 over-extended companies represent roughly 40% of the entire US stock market!
Quite the start
The S&P 500 gained 10.7% through the first five months of 2026, putting it on pace for a 15%+ gain for a fourth year in a row. The only other time the benchmark achieved the feat was the five-year streak from 1995-99. The longer the rally continues, the more it resembles the late-1990s bull.
Both were fueled by a revolutionary technology that triggered capex spending and productivity gains. As is always the case, there are key differences, including demographics, consumer sentiment, and geopolitics, just to name a few. I don’t think there is any need to go into each of them as the liberal media has chosen to solely focus on these issues while giving zero credit to President Trump and the US economic strength. I find this baffling, daily, but hey, this is why people are still not participating in a historic bull market.
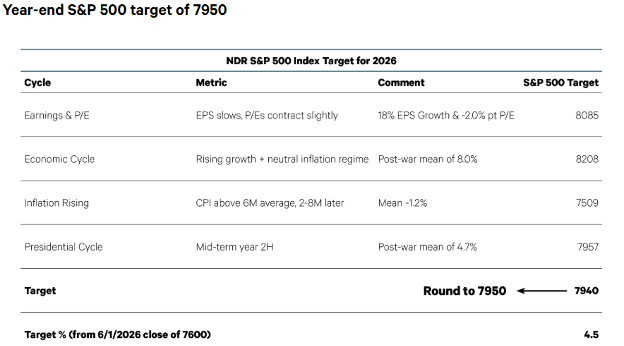
While the debate over how well the current market fits the 1990s analog is fascinating and something we will continue to cover,. The relevant question here is whether the current rally will come to an end over the next number of months. The 1990s analog is again pertinent. Two triggers of the 2000 bear market – rising inflation and technical divergences – are in play but not at bull-breaking levels currently. According to Ned Davis Research, this is how they handicap different reasons for this market advance and where they see the market ending up at year end. They assign a target price of 7940 on the S&P 500. That is approximately 4.6% above current levels. I find these kind of studies quite interesting. Needless to say, even though we are all paying attention to what is glaring in social media with conflicts and such, the fact remains that the markets are reflecting economic prosperity for a variety of reasons. Here is their chart:
While no one was watching
If one just focused on the headlines of the ludicrous liberal media, the two main stories for the first half were the AI-destroys-software trade and the U.S/Israel-Iran conflict. As a result, the historically strong earnings growth got less attention than it would have otherwise. Last week I focused my report on how truly strong the earnings and revenues are for US companies, but this has not been discussed in the press at all!
The main point is that the 20%+ earnings growth seen in Q1 is more common coming out of recession, not in year seven of an economic expansion. This is hugely important. It is much easier for an economy or a company more specifically to show growth coming off of a bad time than it is for companies and the largest economy in the world to show rampant expansion while in a growth phase. This is almost unheard of and is truly illustrative of the impact of technological advancements. Sales growth has picked up, but the driver has been margin expansion. The trailing 12-month S&P 500 gross margin hit a record high in May see the chart below:
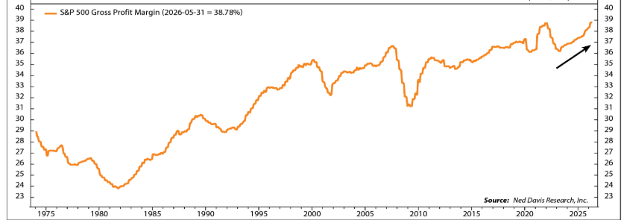
This is a very important chart. Please pay attention to it. Also, notice that in the upper right the aggressive and accelerating move up. AI is a big part of the story, with the Technology sector expected to contribute over half of the S&P 500’s earnings growth in 2026. Meanwhile, most sectors have positive earnings growth, as they are able to pass tariff-induced price hikes to customers while controlling headcount.
Consensus estimates are calling for 21.6% growth in S&P 500 operating EPS in 2026. For most S&P 500 targets, they have been reduced the growth rate by 3% points to 18.6%, which is less than the typical downward revisions over the second half of the year. For many, reducing the operating P/E by two points to 24.7, consistent with the decline in the forward P/E, as investors are paying less for what could be peak earnings growth. This is also very strange. Index price objectives should be based on earnings, earnings, earnings. But instead, a fear of this rate of acceleration is driving targets to under promise and probably will over deliver!
So, where is all of this growth in income of companies and growth in equity prices coming from? I begin by looking under the hood at the manufacturing level. This is the PMI’s, ISM’s, and labor numbers. If the manufacturing side of the economy is experiencing excess demand, and therefore higher prices, and labor is strong, then the next domino to fall should be earnings and revenues of companies.
U.S. manufacturing activity strengthens
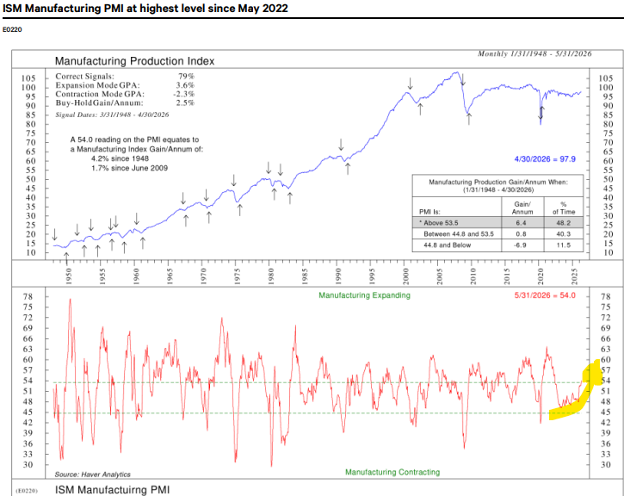
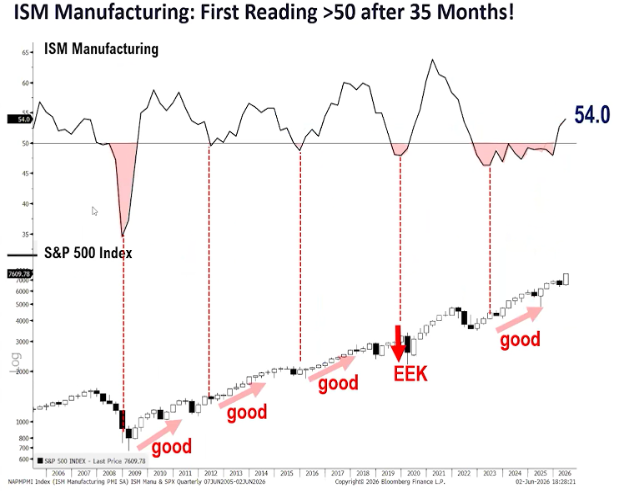
The ISM Manufacturing PMI increased 1.3 points in May to 54.0, a four-year high and above the consensus. It is consistent with strengthening manufacturing output growth and continued economic expansion. The ISM estimates that the latest PMI corresponds with a 2.2% annualized growth rate in real GDP.
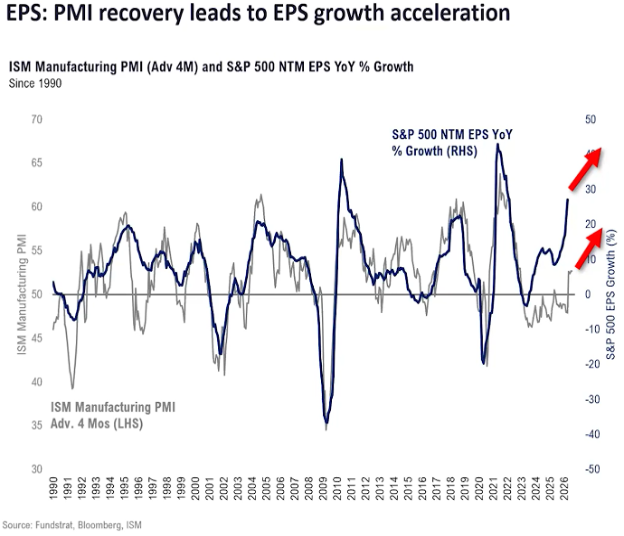
Separately, the S&P Global U.S. Manufacturing PMI rose 0.6 points in May to 55.1, slightly below the consensus and the flash estimate of 55.3. But this is still the highest level in four years, confirming the message of stronger manufacturing sector growth in the ISM survey. Input and output price pressures both accelerated to the highest level since Q3 2022, as manufacturers sought to pass through higher fuel and other material prices to their customers. Firms were still optimistic about the 12-month growth outlook, but less so than in the past few months, as geopolitics and higher inflation weighed on sentiment. As can be seen below, PMI’s have been in lockstep with earnings and as far as I can see, PMI’s are on the rise and earnings clearly are too, just as expected. This should bode for higher equity prices:
Just as PMI’s lead and drive higher earnings growth and growth acceleration, the ISM numbers are also confirming this number across the board. As can be seen below, when ISM readings are above 50, the stock market tends to be in an uptrend. This move currently breaks above 50 for the first time since 2022. I believe that even though seasonally things could be a bit challenging through the summer, the year should be a good one. Here is the proof:
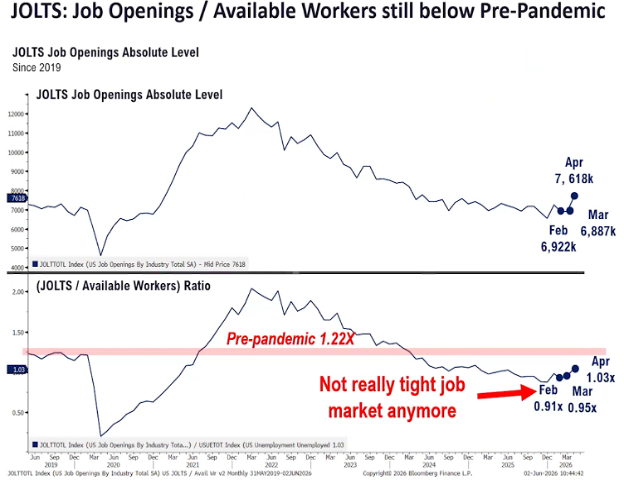
From previous Fed Chair Powell, he had always indicated that Labor was what he followed. Because if hiring was improving then this would tend to mean that businesses were healthy and expanding. If this is the case, and if jobs are following the PMI’s and ISM numbers, then the current JOLTS or job openings are starting to show once again, strong economic expansion. Strangely enough, this is occurring in the middle of an economic cycle, not at the beginning after a recession. This again speaks to the vast improvement from AI. See the jobs readings below:
Midterm years often end on a high note
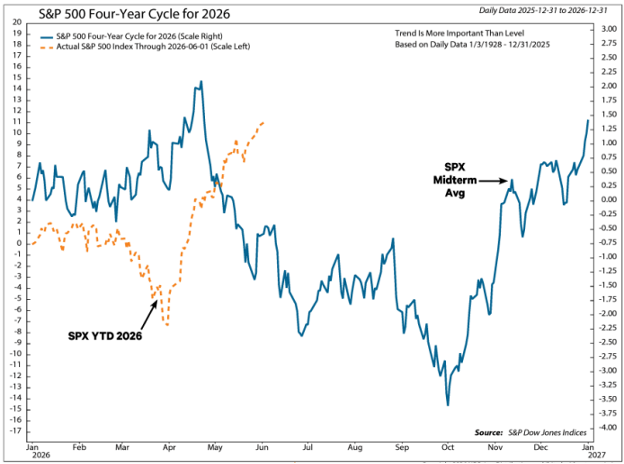
The S&P 500 roughly followed its midterm year average pattern through February before diverging during the March selloff and April-May rebound. Since this is recent history, and the events of this year are top of mind to most investors, one needs to evaluate “what is different this time.” The conflict in the Middle East likely brought some of the typical midterm year weakness forward, and as I have I’ve stated, the markets seemed to have been experiencing a rolling correction on a sector-by-sector basis. This seemed to mask the overall market advance.
History suggests additional weakness is possible, especially late in Q3 amid the midterm election angst. In Mark Newton’s June Technical commentary on June 4th, he stated without reservation that he is expecting the third quarter to be the most difficult one, and that the fourth quarter, if history comes true once again is the strongest quarter of an entire four-year presidential election cycle.
Two weeks ago, I wrote commentary on the makeup of the voting constituency of the polling numbers. There is a clear bias to the liberal / Democratic side of the scale. Since the liberal voters and media seem to relentlessly be suffering from TDS (Trump Derangement Syndrome) they are continuing to kick and scream about how bad everything is going. This is extremely evident in the AAII (American Association of Individual Investors) survey. Going into Friday’s down market, the AAII survey still showed more bears than bulls even though the markets were putting in a historic record. So, this brings us to the midterms. As we get closer to the time that voters enter the polls, the outcome has become less uncertain, and the market have tended to enter a year-end rally. Point-to-point, the S&P 500 has risen 4.7% in the second half of midterm years, on average. Given the historically overbought condition of the Technology sector, a Tech-led mean-reversion pullback could align with the midterm pattern. This could be the pause to refresh that could be needed going into a year-end push.
I find the current market relative to the historical statistical data particularly interesting as 2026 has done exactly the opposite of what “normally” happens in the midterm year. In February there was a drastic decoupling that happened. Whereas midterm years tend to hit high points in later April (just after tax day) and swoon into October, this year has been a bit of a moonshot. Straight up for two months straight. This is part of the reason that I have been espousing the need to be vigilant on following the breadcrumbs! This is what the year looks like so far vs. the average going back to 1928:
I don’t mean to sound like a broken record, but if the industrial side of the economy is strong and getting stronger, and the job market is showing increased hiring, and inflation although elevated is remaining in check, and bond interest rates remain firmly locked in a very tight range, and there is no apparent signs of a recession in the cards, then quite possibly this market, as stated by Thomas Lee of FundStrat, could have much further to run.
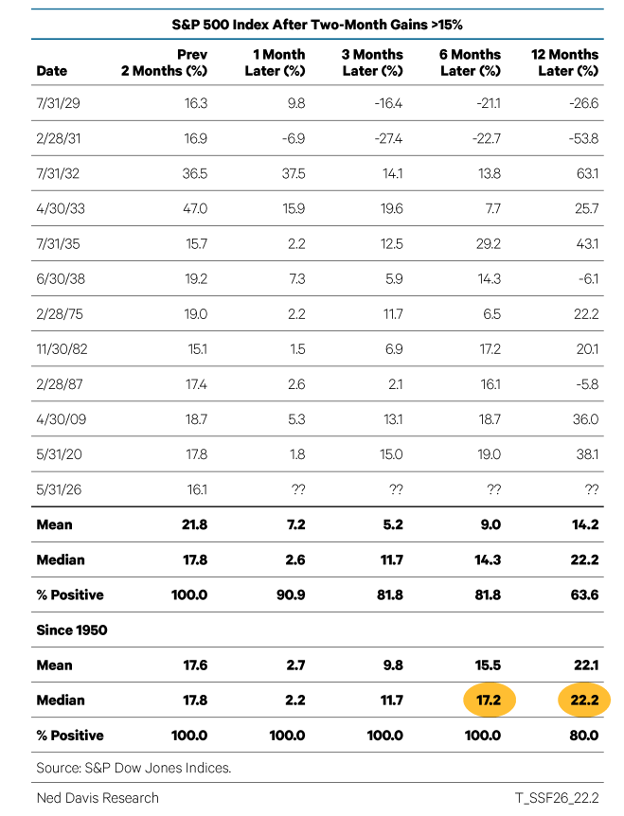
This brings me to another statistical measure that seems to be quite consistent. When measuring what could be expected, in a midterm year, following what we are seeing this year, which as seen above is very different than what “normally” happens, I did a study to see what happens following a run of 15% plus in the S&P over a two-month time period. Since this was an almost record setting run that we have experienced since the March 30 low, I thought that this might be a move to use as a precursor indicator of what to come.
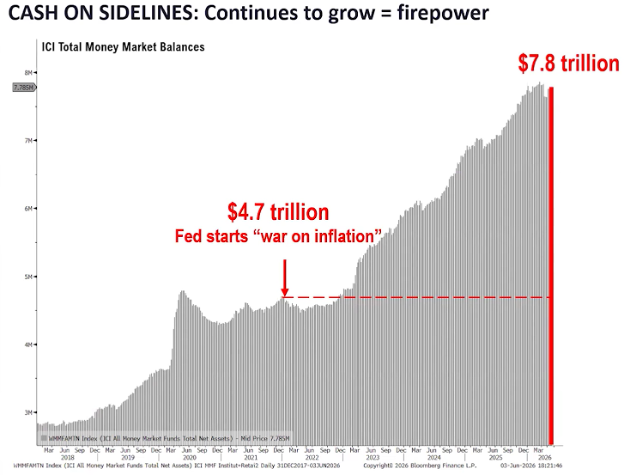
The rally that continued in May reinforced a two-tiered technical theme since the March 30 low: cap-weighted indices have surged more than the average stock. This addresses the point of a small number of companies driving the markets higher without the troops joining the generals. This is a sign of non-supportive lack of breadth in the advance. It warrants mentioning as a risk to our positive outlook. The S&P 500 gained 16.1% in April-May, the biggest two-month rally since April-May 2020 (this was the bounce off the bottom of the COVID low) and the fifth best since 1950. After 15%+ rallies over two months, the S&P 500 has risen a median of 17.2% six months later and 22.2% 12 months later. Most cases were coming off major bear market lows in 1975, 1982, 2009, and 2020. The only exception was February 1987. To me, this begs the question as to whether the massive cash on the sidelines, still over $7 Trillion is having an influence not just on the continued growth of inflation, but also an almost unusable amount of investment capital. For now, we will not know but suffice it to say that things have been good and therefore, if history is precedent, things should continue to be good. See chart below:
I will conclude with one of my favorite pictures that is one of the most under followed. This is a picture of just how much dry powder is sitting on the sidelines. Note that not only is this number one that can hardly be calculated, but that if it were to simply sit in 3-month US Treasuries it would almost generate enough in interest to provide the needed firepower to propel the markets to continued new and higher highs. I don’t say this with blinders on, and I do understand the everything needs a rest, but if the continuum is the continuum, then the path of least resistance belongs to US equities and direction appears to be higher. Here is the picture:
-Ken South, Tower 68 Financial Advisors, Newport Beach
Important Disclosures:
The opinions voiced in this material are for general information only and are not intended to provide specific advice or recommendations for any individual. To determine which investment(s) may be appropriate for you, consult your financial professional prior to investing. All performance referenced is historical and is no guarantee of future results. All indices are unmanaged and cannot be invested into directly.
All information is believed to be from reliable sources; however LPL Financial makes no representation as to its completeness or accuracy.
Investing involves risks including possible loss of principal.
The Standard & Poor's 500 Index is a capitalization weighted index of 500 stocks designed to measure performance of the broad domestic economy through changes in the aggregate market value of 500 stocks representing all major industries. The S&P 500 is a stock market index tracking the stock performance of 500 of the largest companies listed on stock exchanges in the United States. Indexes are unmanaged and cannot be invested in directly.
The Dow Jones Industrial Average is comprised of 30 stocks that are major factors in their industries and widely held by individuals and institutional investors.
The Nasdaq-100 is a large-cap growth index. It includes 100 of the largest domestic and international non-financial companies listed on the Nasdaq Stock Market based on market capitalization.
The NASDAQ Composite Index measures all NASDAQ domestic and non-U.S. based common stocks listed on The NASDAQ Stock Market. The market value, the last sale price multiplied by total shares outstanding, is calculated throughout the trading day, and is related to the total value of the Index. Indexes are unmanaged and cannot be invested in directly.
The Russell 2000 Index is an unmanaged index generally representative of the 2,000 smallest companies in the Russell 3000 index, which represents approximately 10% of the total market capitalization of the Russell 3000 Index.
Data sourced from Bloomberg (2025).
Stock investing includes risks, including fluctuating prices and loss of principal.
Bonds are subject to market and interest rate risk if sold prior to maturity. Bond values will decline as interest rates rise. Bonds are subject to availability, change in price, call features and credit risk.
Government bonds are guaranteed by the US government as to the timely payment of principal and interest and, if held to maturity, offer a fixed rate of return and fixed principal value.
Bond yields are subject to change. Certain call or special redemption features may exist which could impact yield.
International investing involves special risks such as currency fluctuation and political instability and may not be suitable for all investors.
Alternative investments may not be suitable for all investors and should be considered as an investment for the risk capital portion of the investor’s portfolio. The strategies employed in the management of alternative investments may accelerate the velocity of potential losses.
This information is not intended to be a substitute for specific individualized tax advice. We suggest that you discuss your specific tax issues with a qualified tax advisor.
The economic forecasts set forth in this material may not develop as predicted and there can be no guarantee that strategies promoted will be successful.
The financial professionals with Tower 68 Financial Advisors are registered with, and securities and advisory services are offered through LPL Financial, a registered investment advisor. Member FINRA/SIPC.
LPL Tracking # 1121981