


The only thing that there seems to be to buzz about right now is interest rates and bond prices in general. Long-term interest rates have been grinding higher since the start of the Iran conflict. The latest move started around the time of Kevin Warsh’s second press conference. Last Monday, the 30-year Treasury bond yield hit 5.31%, its highest level since June 2007. To do the historical measurement, this is the highest interest rate we have seen in 19 years. The benchmark 10-year yield stands at 4.72%, just below its 2026 high. Joe Kalish of Ned Davis Research warned us about this. Since Arthur Burns, the 10-year Treasury yield has risen seven out of seven times in the first three months of a new Fed chair’s term. We are days away from extending the streak to eight.
The question from here for equity investors is whether the latest yield backup is just another case of investors learning the rules of engagement with a new Fed chair, or a new era of higher interest rates that could derail the bull market. The bottom line is that the trend in long-term interest rates is already signaling caution and is part of the mosaic including continued strong earnings expectations, excessive optimism, seasonality, and midterms that suggestion a near-term pullback is possible. However, the yield curve and some relative valuations are not yet in bearish territory. This is why I went into detail of all the hot points last week. If you have not given last week’s note a read, you really must stop right now and go read it. In this week’s note, I will be going into the whole interest rate issue. It is a fallacy that higher rates cause stock prices to decline. It is much more important to pay attention to “why” interest rates are on the rise and to what extent they are on the rise rather than simply a game of red light, green light.
Before I go into the current situation, I want to provide the complete picture of interest rates. I will focus on the 30-year US Treasury and the 10-year US Treasury. The 30-year is considered the “long bond,” and the 10-year is the bond that mortgage interest rates are pegged to. Here is a picture going back to the Great Financial Crisis:
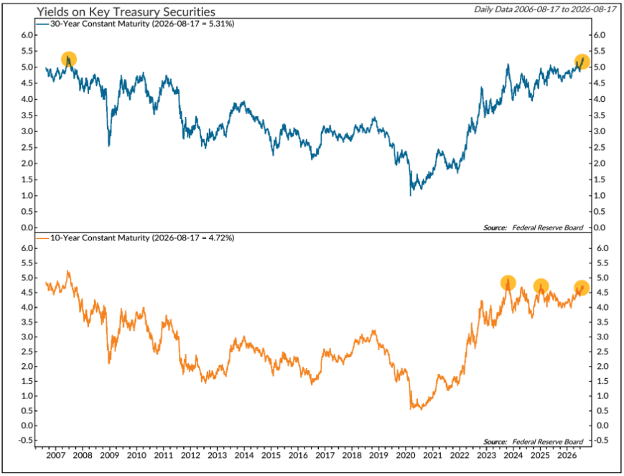
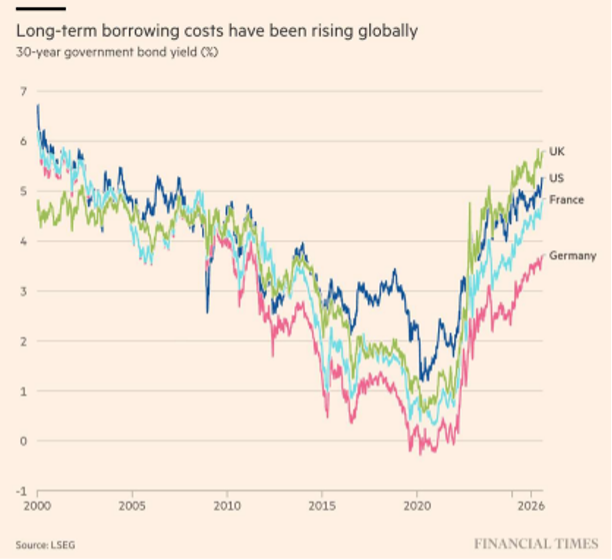
As can be seen above, the rates bottomed March 2020 when the world shut down due to COVID. Since then, the rise in rates has been a steady climb. Note, I say steady climb, not a spike higher. It was just in the past week that we saw rates eclipse the high points from the irrational exuberance of the real estate that precluded the Great Financial Crisis. Here is a clear picture of what interest rates have done on the World Stage since the COVID cash dump:
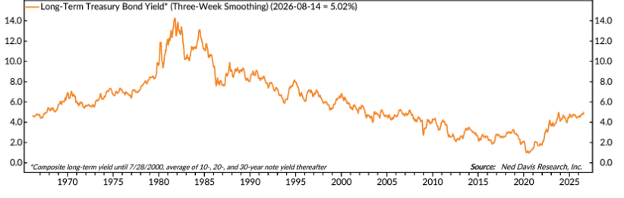
It should be noted that this takes a specific slice in time and it appears that there has been a complete reversal from a high to an ultimate low and now to the original high. If we are to stretch out the time period to the 1960’s, this move is clearly a rise, but not anything that major given how rates actually dropped from around 14% down to almost 0% and are now in the process of normalizing.
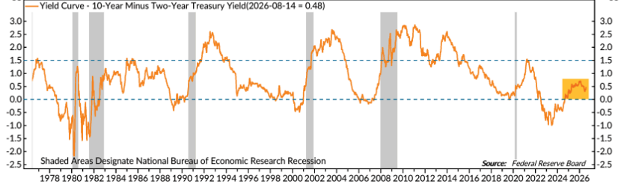
Are we in the new sweet spot of the yield curve?
The yield curve can be a tricky indicator for stocks because it can be driven by many reasons. Generally speaking, an inverted curve implies Fed policy is too tight, and economic growth is likely too slow. A steeply upward sloping curve implies the opposite – that the Fed is not doing enough to fight inflation. A modestly upward sloping yield curve indicates inflation and growth are in balance enough for the economy to grow. That is an apt description of the current economic backdrop. Despite the gyrations at both ends of the curve of late, the rates seem to be telegraphing a current environment where the rate of growth and the rate of inflation are really in balance. This is why the new Fed Chair, Warsh, is extremely reluctant to make any moves at present. Although, this week’s Jackson Hole event could give a bit more color on what the Fed Chair is really thinking. Even though the stated target is for 2% inflation, the current inflation rate of approximately 2.6% is pretty close and if too much action is taken by the Fed this could interrupt the balance that is currently in place. Here is a picture of exactly where we are. Note the dotted lines bracket the “sweet spot.” We are firmly entrenched here right now.
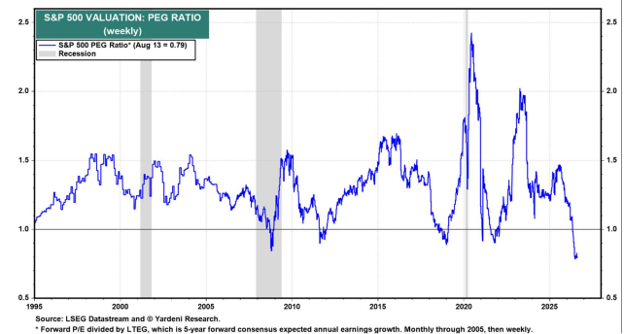
Even though equity valuations were high on an absolute basis for much of the last 15 years, they offered a better risk/reward than bonds, provided the economy was not in recession. The end of ZIRP (zero interest rate policy) shifted the conversation from TINA (there is no alternative to stocks) to TARA (there are reasonable alternatives to stocks). Warsh seems eager to take the next step and let the markets determine the appropriate level of interest rates, and in turn, valuations of other asset classes. I believe that this is far different than previous chair, Jerome Powell, who tended to jawbone the rate picture where he wanted it. Hence, the markets are having a tough time dealing with Warsh’s new style. Where the Fed Chair is really between a rock and a hard spot is in looking at equity valuations. The age-old way to measure market levels is by using historical P/E ratios. But I feel it is much better to look at PEG ratios. This is price as measured by growth rates. Since earnings are on fire, we are now at a historical “cheap point.” Yes, the prices are cheaper, based on earnings growth, than ever before!
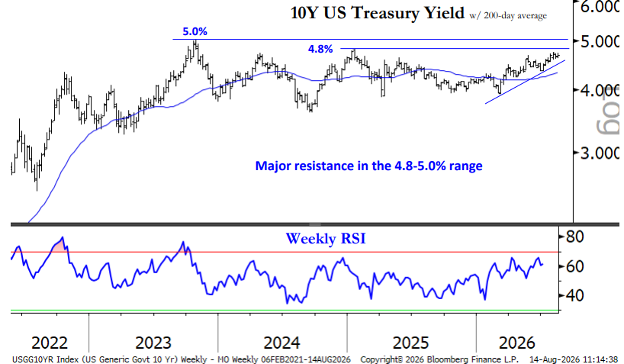
In a more generic discussion of the level of yields (interest rates): stability matters more than direction for us, it’s neither high nor low rates, but stable rates that have historically been most supportive for long-term equity gains. This can be seen in the chart below where markets seemed to be most attractive when rates were in the sweet spot. Since peaking at 5% in October 2023, the 10-year US Treasury yield has experienced large swings but has remained range-bound overall. This three-year range has coincided with the broadest phase of the current bull market. While rates should continue to trend higher over the near-term, we are not convinced a sustained multi-year breakaway is imminent. For equity investors, a sharp move higher or lower in yields, coupled with definitive shift toward defensive leadership, would be concerning. For now, we expect high-beta cyclicals to remain favor.
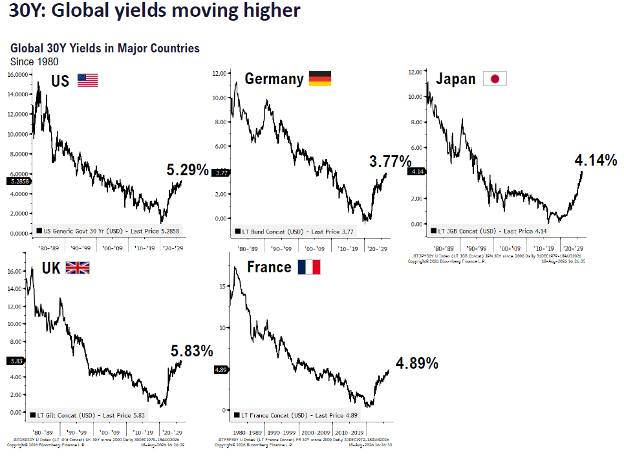
To give some perspective on where our rates are relative to the rest of the world, I thought I would provide some comparative analysis. Here is our rates vs. the biggest European economies and Japan. Strangely enough, our rates are about the highest even though our economy is clearly the strongest. This is quite abnormal as stronger economies should be able to be construed as safer and be afforded a lower interest rate.
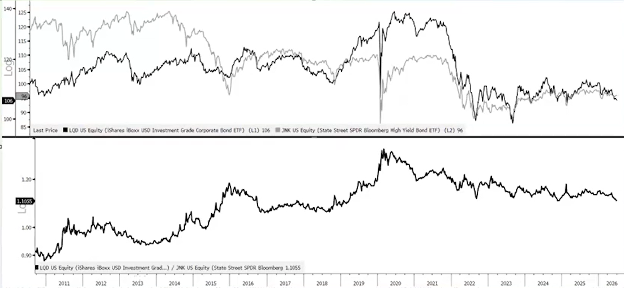
Besides paying attention to rates from a historical perspective. My favorite thing to monitor is the rate that BB Bonds (junk or high yield bonds) are demanding, compared to same maturity US Treasury debt. In a strong and stable economy, the fear of corporate bond defaults should be very low, and when the economy hits stormy times the fear of default increases. This is illustrated by the difference between high yield bond rates and Treasury rates. As can be seen below, they are not only very close, but in the lower graph they are getting even closer. This tends to imply that the economy is strengthening. Clearly not a preemptive move to a rocky picture for corporate America and its earnings expectations.
Corporate earnings have remained exceptionally strong in Q2. With 89% of S&P 500 companies reporting, 85% have beaten consensus estimates. If the pace holds, it will mark the fourth-highest earnings beat-rate since 2001 and the second highest excluding COVID. Just as impressive as the results have been the revision trends, with analysts aggressively raising their outlooks in recent weeks. Ten of 11 sectors of the S&P 500 have seen estimates rise over the past three months. Revision momentum remains strongest for cyclical growth sectors. Over the past three months, analysts have raised the year-ahead estimate for Technology by nearly 18%, the strongest among all sectors. Consumer Discretionary (14%) and Communication Services (9%) have also seen significant positive revisions over the period. Revisions have accelerated for all three sectors compared to late 2025 and are near levels that have been more commonly associated with equity recoveries from bear markets. This is why I tend to think that we are in a statistically difficult seasonal period, not in the beginning of something bad starting to happen.
Collectively, the data suggest that analyst optimism has been broad based, but earnings revision momentum remains greater in Growth-oriented sectors. Technology has continued to show the strongest revision trends. Communication Services and Consumer Discretionary have also improved materially. If Growth sector earnings continue to top expectations and estimates continue to move higher at a faster pace than the rest of the market, the fundamental backdrop could support another rotation towards Growth later this year.
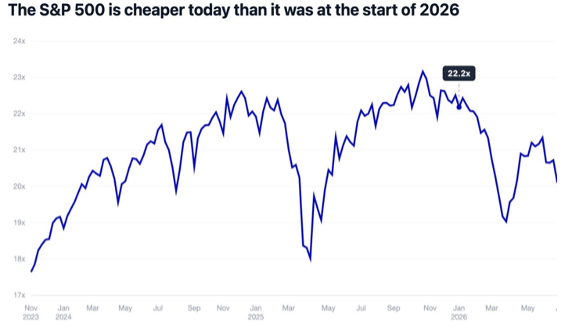
In closing, a couple of charts I have shared before. The first is the current valuation or P/E ratio of the S&P 500. Even though the index is up 12% for the year, the P/E has dropped from 22 to 20. This is almost unheard of and clearly illustrates how incredibly strong company earnings have been. Markets are up but valuations are cheaper!
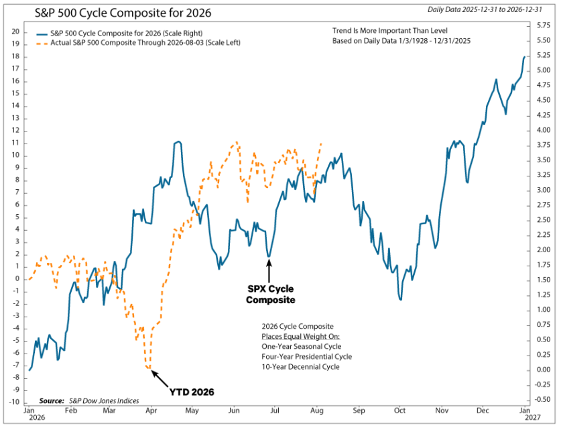
Second is the 4-year Presidential Cycle. We are in a mid-term year. In the month of August. If history holds true, we are entering the most difficult period. The mystery will be whether earnings are strong enough to allow the markets to digest part of their advance for the year, or whether seasonal factors will outweigh economic strength. On this one, I can’t give a good answer! Here is the picture:
- Ken South, Tower 68 Financial Advisors, Newport Beach
Important Disclosures:
The opinions voiced in this material are for general information only and are not intended to provide specific advice or recommendations for any individual. To determine which investment(s) may be appropriate for you, consult your financial professional prior to investing. All performance referenced is historical and is no guarantee of future results. All indices are unmanaged and cannot be invested into directly.
Investing involves risks including possible loss of principal. No strategy assures success or protects against loss. There is no guarantee that a diversified portfolio will enhance overall returns or outperform a non-diversified portfolio. Diversification does not protect against market risk.
The Standard & Poor's 500 Index is a capitalization weighted index of 500 stocks designed to measure performance of the broad domestic economy through changes in the aggregate market value of 500 stocks representing all major industries. The S&P 500 is a stock market index tracking the stock performance of 500 of the largest companies listed on stock exchanges in the United States. Indexes are unmanaged and cannot be invested in directly.
The Dow Jones Industrial Average is comprised of 30 stocks that are major factors in their industries and widely held by individuals and institutional investors.
The Nasdaq-100 is a large-cap growth index. It includes 100 of the largest domestic and international non-financial companies listed on the Nasdaq Stock Market based on market capitalization.
The NASDAQ Composite Index measures all NASDAQ domestic and non-U.S. based common stocks listed on The NASDAQ Stock Market. The market value, the last sale price multiplied by total shares outstanding, is calculated throughout the trading day, and is related to the total value of the Index. Indexes are unmanaged and cannot be invested in directly.
The Russell 2000 Index is an unmanaged index generally representative of the 2,000 smallest companies in the Russell 3000 index, which represents approximately 10% of the total market capitalization of the Russell 3000 Index.
Data sourced from Bloomberg (2025).
Stock investing includes risks, including fluctuating prices and loss of principal. No strategy assures success or protects against loss. There is no guarantee that a diversified portfolio will enhance overall returns or outperform a non-diversified portfolio. Diversification does not protect against market risk.
Bonds are subject to market and interest rate risk if sold prior to maturity. Bond values will decline as interest rates rise. Bonds are subject to availability, change in price, call features and credit risk.
Government bonds are guaranteed by the US government as to the timely payment of principal and interest and, if held to maturity, offer a fixed rate of return and fixed principal value.
Bond yields are subject to change. Certain call or special redemption features may exist which could impact yield.
International investing involves special risks such as currency fluctuation and political instability and may not be suitable for all investors.
Alternative investments may not be suitable for all investors and should be considered as an investment for the risk capital portion of the investor’s portfolio. The strategies employed in the management of alternative investments may accelerate the velocity of potential losses.
This information is not intended to be a substitute for specific individualized tax advice. We suggest that you discuss your specific tax issues with a qualified tax advisor.
The economic forecasts set forth in this material may not develop as predicted and there can be no guarantee that strategies promoted will be successful.
The financial professionals with Tower 68 Financial Advisors are registered with, and securities and advisory services are offered through LPL Financial, a registered investment advisor. Member FINRA/SIPC.
LPL Tracking #1161090