

History suggests near-term consolidation, but a positive prognosis for the stock market over the intermediate term. Of concern was the deteriorating market breadth since mid-April. Most divergences resolve themselves to the upside; however, some do turn into cyclical peaks.
A complicating factor is the massive stock offerings in the area most responsible for recent gains – Technology/AI – increase the risk of a pullback in the cap-weighted benchmarks heading into the fourth quarter. From a technical perspective, we will be watching to see if any pullbacks in recent leaders are healthy rotations into previous laggards or a continued narrowing more reflective of a bull market top. More broadly, we will be watching to see if a reduction from our overweight exposure to U.S. stocks versus bonds and cash is warranted.
Put aside the downdraft on chips and related stocks and look at the overall economy and what is really happening in boardrooms. They have become much more settled, realistic and optimistic about investing, M&A, and growth. M&A this year will possibly hit a record, IPO’s will be far above anything ever seen in history, expansions of production facilities are now being invested well beyond data centers. Although there is this historic flood of new capital into the stock market with mega IPO’s, $250 billion of stock value has come out due to companies being taken private. The capital markets are booming as companies are looking past Iran, oil and fertilizer prices, a bump up in inflation, and the elections, and betting huge on future growth.
While inflation remains higher, if you strip out energy and food the real number is 2.9% core. Not really high. Once gas prices return to their prior level, CPI returns under 3%. The Fed is likely to just do nothing for several months. This then removes the fears of the unknown of the new Fed Chair Warsh. He says he is going to use a different set of metrics to evaluate the economy and how the Fed should act, but it appears that the markets may have already adapted to this. Despite all that is happening and higher oil prices, the US economy is powering ahead and growing very well. Most importantly, jobs are being created and wages are rising a little faster than inflation. While the lower income cohort is pressed due to inflation of gas prices, and to some extent food prices, consumers are still spending well, so the economy will continue to do well. We have no idea at all what comes next with Iran so projecting when gas prices will fall is not possible now. But it will likely happen late this summer, we just do not know when.
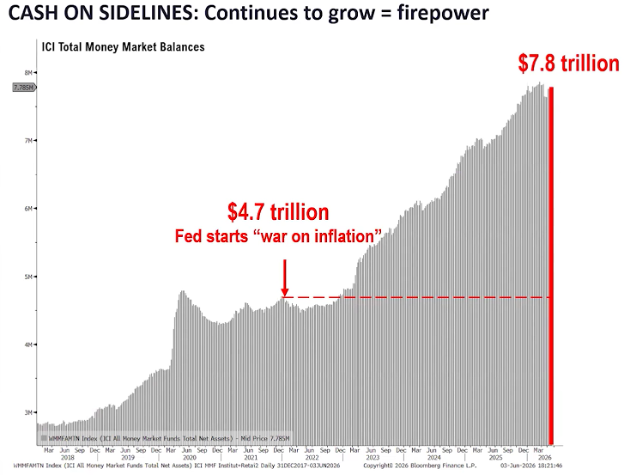
There is believed to be round $7 Trillion of cash potentially available to go into the stock market, sitting in money funds and other liquid accounts. Even if only some of that comes into the stock market it will make a good upside difference. A sizable chunk will go to the new IPO’s. The US continues to be the world dominant economy, and the most liquid securities markets, so while some investment capital has migrated to emerging markets, even to Europe, that capital is not so great as to cause a material flow out of the US.
The rest of the analysis walks through studies and indicators to watch heading into the second half. Two Fridays ago, the S&P 500 tumbled 2.6%, its worst day since October 10, 2025. The plunge also ended a nine-week winning streak for the benchmark, which tied for the sixth longest since 1928 and fourth longest since WWII. The table below shows the S&P 500 around previous nine-week streaks.
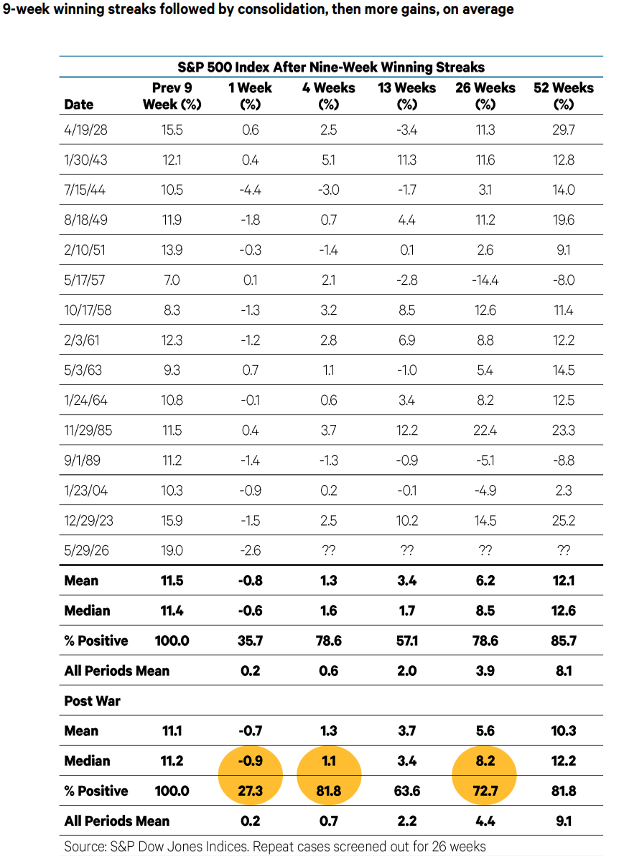
The first interesting stat is that the 19.0% gain in the nine weeks ending May 29 is the highest in the table, confirming other studies that the rally over the past two months is one for the record books. Second, returns over the near term have been mixed. Few nine-week streaks survive a tenth week. The market has tended to recover quickly, however. Since 1946, four weeks later, the S&P 500 has been higher 82% of the time. The gains have tended to continue. Six months later, the S&P 500 has been higher 73% of the time by a median of 8.2%, nearly double its long-term average. Returns one year later have been above average, although the mean and median are not much higher than over any 52-week period.
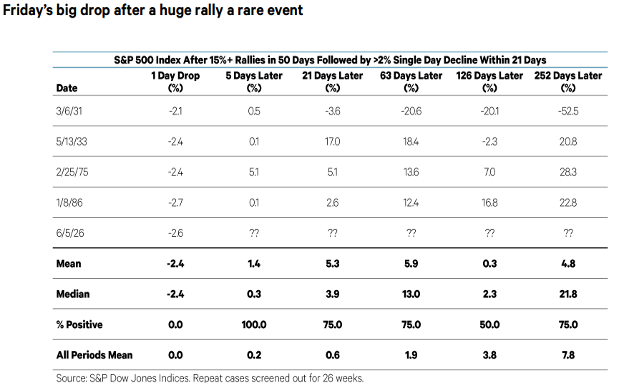
The Friday drop spawned another question: what has happened if big rallies have been followed by sharp reversals?. The table below shows all cases when the S&P 500 has risen by at least 15% in 50 trading days and then experienced a single day decline of at least 2% within trading 21 days (one month). The list is short, with June 5 being the fifth case since 1928 and the third post-war. Subsequent returns were positive, especially in the two previous post-war cases.
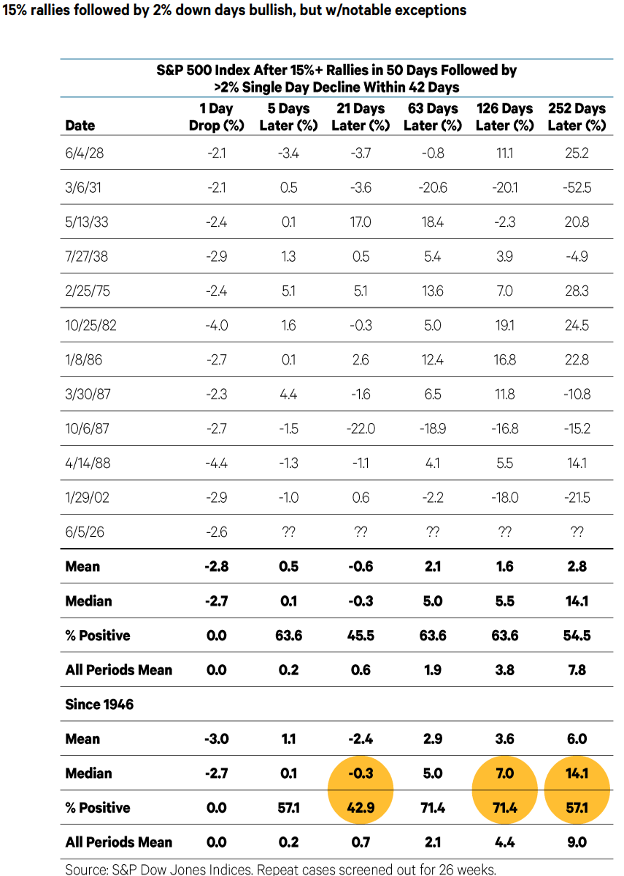
The final table expands the window to 42 trading days (two months) for a 2% down day. The returns are similar to the nine-week winning streak study above. After some consolidation – this time returns one-month later are below average – the S&P 500 has posted above average, but not spectacular, returns six and 12 months later. The lower means versus the medians reflect the fact that study captures some major bear markets like the 1987 crash and the final down leg of the 2002 cyclical bear. This is the tail end of the Dot Com Bubble. Our conclusion from the studies is that the more likely outcome is a period of consolidation before a resumption of the uptrend, but that a blow off top cannot be dismissed.
The massive offering that occurred last week was not only historic, but attention grabbing. I will say that this has generated perhaps the highest interest I have seen in over 20 years from investors, dogs, cats, and grandparents! When I’m in a public place and people hear that I’m involved professionally in the stock market, there has been no hesitation in asking my opinion. I will say that it is difficult to explain my answer when it encompasses not just an opinion of the company but also the impact it is having on the weighting and make up of the indexes. This is truly historic and could be repeated by the other large offerings that could be slated to occur in the second half of this year.
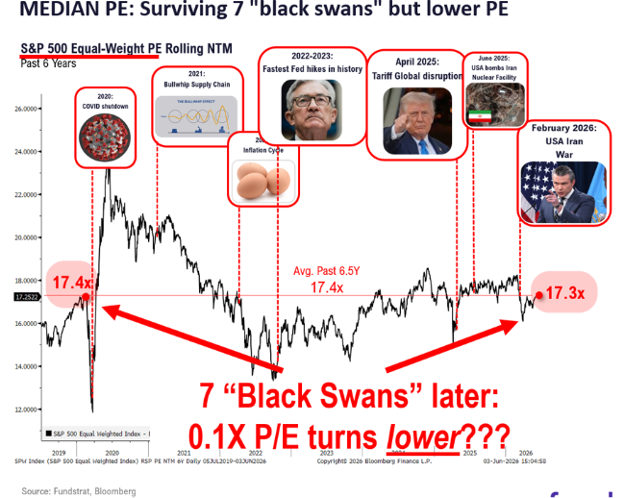
One item that due to the hype of the war, oil, IPO’s and other anxiety generating events is the underlying health of the overall US stock market. If we are to look at where the market currently sits on an earnings basis, the rise in prices has done little to make the markets more expensive. Notably, although we are already on our 7th black-swan event since 2020 (the U.S.-Iran war), the P/E of the S&P 500 on an equal-weighted basis is still below where it was in 2019. If you had put a company to a test like this and it survived without any meaningful earnings decline, we would say that its multiple needs to go up. Similarly, our view for the S&P 500 as a whole is that the multiple should go higher, in contrast to concerns about high valuations that skeptics have voiced after the recent rally.
We are entering the dog days of summer. Normally, this is a time that market activity slows down, and people try and either enjoy summer with their kids or at least stay in from the heat. Well, doesn’t quite feel like that in the markets that’s for sure! According to many cycle studies and seasonal data we are destined for some type of correction period in the August / September time period, but if the valuation chart above is truly the case, the $7 Trillion on the sideline will continue to be deployed and the markets could exhibit this phase as a flat spot rather than a decline of any substance. I believe that baring some large exogenous event, basically everything is in place for a continuation of the current market advance.
-Ken South, Tower 68 Financial Advisors, Newport Beach
Important Disclosures:
The opinions voiced in this material are for general information only and are not intended to provide specific advice or recommendations for any individual. To determine which investment(s) may be appropriate for you, consult your financial professional prior to investing. All performance referenced is historical and is no guarantee of future results. All indices are unmanaged and cannot be invested into directly.
All information is believed to be from reliable sources; however LPL Financial makes no representation as to its completeness or accuracy.
Investing involves risks including possible loss of principal.
The Standard & Poor's 500 Index is a capitalization weighted index of 500 stocks designed to measure performance of the broad domestic economy through changes in the aggregate market value of 500 stocks representing all major industries. The S&P 500 is a stock market index tracking the stock performance of 500 of the largest companies listed on stock exchanges in the United States. Indexes are unmanaged and cannot be invested in directly.
The Dow Jones Industrial Average is comprised of 30 stocks that are major factors in their industries and widely held by individuals and institutional investors.
The Nasdaq-100 is a large-cap growth index. It includes 100 of the largest domestic and international non-financial companies listed on the Nasdaq Stock Market based on market capitalization.
The NASDAQ Composite Index measures all NASDAQ domestic and non-U.S. based common stocks listed on The NASDAQ Stock Market. The market value, the last sale price multiplied by total shares outstanding, is calculated throughout the trading day, and is related to the total value of the Index. Indexes are unmanaged and cannot be invested in directly.
The Russell 2000 Index is an unmanaged index generally representative of the 2,000 smallest companies in the Russell 3000 index, which represents approximately 10% of the total market capitalization of the Russell 3000 Index.
Data sourced from Bloomberg (2025).
Stock investing includes risks, including fluctuating prices and loss of principal.
Bonds are subject to market and interest rate risk if sold prior to maturity. Bond values will decline as interest rates rise. Bonds are subject to availability, change in price, call features and credit risk.
Government bonds are guaranteed by the US government as to the timely payment of principal and interest and, if held to maturity, offer a fixed rate of return and fixed principal value.
Bond yields are subject to change. Certain call or special redemption features may exist which could impact yield.
International investing involves special risks such as currency fluctuation and political instability and may not be suitable for all investors.
Alternative investments may not be suitable for all investors and should be considered as an investment for the risk capital portion of the investor’s portfolio. The strategies employed in the management of alternative investments may accelerate the velocity of potential losses.
This information is not intended to be a substitute for specific individualized tax advice. We suggest that you discuss your specific tax issues with a qualified tax advisor.
The economic forecasts set forth in this material may not develop as predicted and there can be no guarantee that strategies promoted will be successful.
The financial professionals with Tower 68 Financial Advisors are registered with, and securities and advisory services are offered through LPL Financial, a registered investment advisor. Member FINRA/SIPC.
LPL Tracking # 1125834