


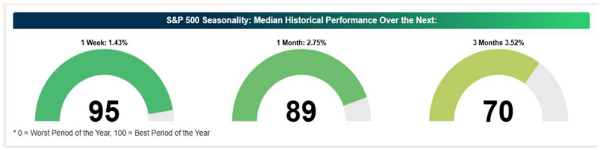
The summer has a reputation for slow, boring stock market action. That may sometimes be the case, but on average the period beginning right about now has historically been very kind to investors. Not only is this week typically one of the best of the year, but it also kicks off one of the better stretches on the calendar up until the middle of September. As I always qualify anytime I discuss seasonality, it should only act as a general guide rather than a guarantee. We still must respect the price action, though history does suggest the window is there to continue the rally. Here is what the statistics show for this week and then for the month that next 3 months:
To put it into a broader context, I took the last 20 years and added every year together with the next one to maybe get a clue as to what the year could look like and more specifically, as is the reason for authoring this note, I want to get a bit of a closer look at the month of July. I have circled in yellow the chart action for July:
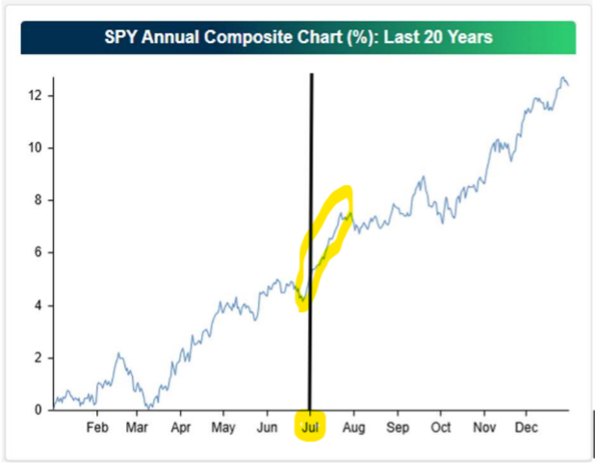
July has been the best month for the S&P 500 over the past 20 years. 80% of the time the index has closed higher than it began the month, and the average gain of 2.54% is the highest of any month. Again, we cannot assume it will definitely finish higher this time, but the opportunity is certainly there. It should also be remembered that this takes into account a lot of black swans, and many different types of Presidential administrations.
The fear backdrop that has begun to develop over the last couple of weeks tends to set up the month quite nicely as well. The S&P 500 gained a net 1.75% in the holiday shortened week but only 49.35% of NYSE operating companies advanced each session, on average. The week before, the S&P 500 lost 1.97%, yet 60.68% of NYSE operating companies advanced each day, illustrating the peculiarities occurring underneath the market’s surface. This may not seem particularly important to many, but I see it as a manifestation of the generals taking their well-deserved rest and the troops getting their days in the sun. Hence, the reason why you had a larger percentage of companies advancing yet the index was down. If the generals (which have a larger vote due to the cap weighted nature of the indexes) have a tough time of it, others can rally but on the surface it isn’t recognizable.
What will be interesting to see moving forward is if the troops can continue their advance and if the generals will get back on their horses as well. This is a tough one to tell, and not really something that can be discussed with certainty due to statistical history. What we do know is that the generals are acting “different this time” as they are advancing with true earnings underneath them to support their price advances where technology problems from the past were due to hopes and dreams of companies being profitable. Unfortunately, companies became overvalued and this became unsupportable and was therefore followed by the elevator-like decline. This time, as I wrote last week, the P/E ratios of the market leaders have declined as their prices have advanced due to earnings advancing even quicker!
Besides the never-ending argument relative to valuations, the issue being bantered about today is about the amount of money being invested with the use of margins. This is considered very speculative as it is investors borrowing and leveraging their portfolios to fund additional purchases of securities. Here is the chart of the current level of margin debt:
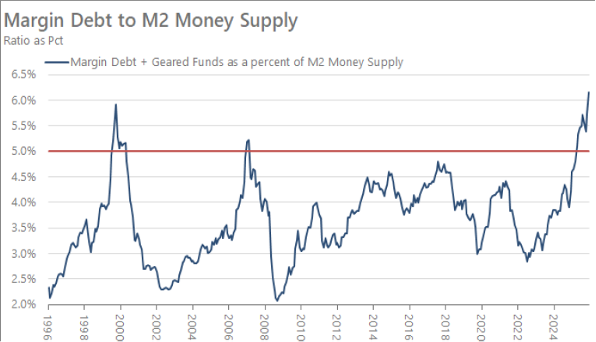
I can clearly understand the graphic nature of this record setting level of debt on portfolios, but I instead choose to look at things a bit differently. Instead, I prefer to look at debt from the perspective of fear of credit quality. What I mean by this is if the institutional investor is concerned about the status of the economy and therefore an overabundance of bad or junk debt being funded, the credit spread between high quality debt and low quality or risky debt should expand. We are currently at the lowest spread seen in some time. This would tend to infer that the expectations for the economy is for broad and expanding quality of businesses and the debt they are incurring to fund their expansion. Here is the chart:
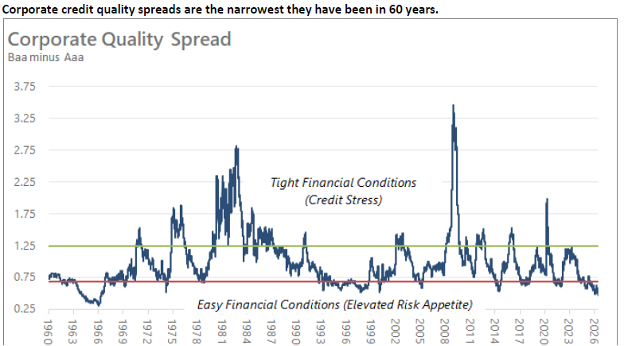
Notice that spikes, or higher spreads occurred during major market dislocations. But when the equity markets are healthy and continuing their advance, the spreads remain tight and defaults remained low.
The next upcoming fly in the ointment is the unknown of the new Fed Chair Warsh’s actions to thwart inflation. The talk is that he could raise interest rates sometime between now and the September Fed meeting. Is this because of inflation caused by high oil prices or is it because of the economy hitting on all cylinders and therefore moving to a overly ebullient growth level? This is a great and as yet not answerable question. This could also be why Thomas Lee of FundStrat Direct feels that the markets could trade at higher highs in the short run but that the August-October time period could by uncomfortably negative.
The S&P 500 has done well historically after a first rate hike when it was not the start of a new tightening cycle. If Kevin Warsh and the Fed can continue to keep longer-term inflation expectations anchored lower, our longer-term interest rate indicators should start turning more constructive on stocks. Stock investors appear to be looking past any projected hike for now. This might change as we get closer to the midterm election hysteria. The newspapers are already banging this drum pretty hard and if this midterm issue coupled with interest rates reflecting a greater probability of higher rates, this could put a lid on the current advance for at least a bit.
At present, interest rates remain locked in the range they have been in since 2025. The credit spread between high quality and junk debt continues to have no hint of credit issues. And the earnings forecasts have continued to progress across many industries. This speaks to broadening economic stability. Corrections always happen for a different set of reasons, and we will do all we can to keep you informed as to what we are seeing should an unfriendly combination of facts develop.
-Ken South, Tower 68 Financial Advisors, Newport Beach
Important Disclosures:
The opinions voiced in this material are for general information only and are not intended to provide specific advice or recommendations for any individual. To determine which investment(s) may be appropriate for you, consult your financial professional prior to investing. All performance referenced is historical and is no guarantee of future results. All indices are unmanaged and cannot be invested into directly.
All information is believed to be from reliable sources; however LPL Financial makes no representation as to its completeness or accuracy.
Investing involves risks including possible loss of principal.
The Standard & Poor's 500 Index is a capitalization weighted index of 500 stocks designed to measure performance of the broad domestic economy through changes in the aggregate market value of 500 stocks representing all major industries. The S&P 500 is a stock market index tracking the stock performance of 500 of the largest companies listed on stock exchanges in the United States. Indexes are unmanaged and cannot be invested in directly.
The Dow Jones Industrial Average is comprised of 30 stocks that are major factors in their industries and widely held by individuals and institutional investors.
The Nasdaq-100 is a large-cap growth index. It includes 100 of the largest domestic and international non-financial companies listed on the Nasdaq Stock Market based on market capitalization.
The NASDAQ Composite Index measures all NASDAQ domestic and non-U.S. based common stocks listed on The NASDAQ Stock Market. The market value, the last sale price multiplied by total shares outstanding, is calculated throughout the trading day, and is related to the total value of the Index. Indexes are unmanaged and cannot be invested in directly.
The Russell 2000 Index is an unmanaged index generally representative of the 2,000 smallest companies in the Russell 3000 index, which represents approximately 10% of the total market capitalization of the Russell 3000 Index.
Data sourced from Bloomberg (2025).
Stock investing includes risks, including fluctuating prices and loss of principal.
Bonds are subject to market and interest rate risk if sold prior to maturity. Bond values will decline as interest rates rise. Bonds are subject to availability, change in price, call features and credit risk.
Government bonds are guaranteed by the US government as to the timely payment of principal and interest and, if held to maturity, offer a fixed rate of return and fixed principal value.
Bond yields are subject to change. Certain call or special redemption features may exist which could impact yield.
International investing involves special risks such as currency fluctuation and political instability and may not be suitable for all investors.
Alternative investments may not be suitable for all investors and should be considered as an investment for the risk capital portion of the investor’s portfolio. The strategies employed in the management of alternative investments may accelerate the velocity of potential losses.
This information is not intended to be a substitute for specific individualized tax advice. We suggest that you discuss your specific tax issues with a qualified tax advisor.
The economic forecasts set forth in this material may not develop as predicted and there can be no guarantee that strategies promoted will be successful.
The financial professionals with Tower 68 Financial Advisors are registered with, and securities and advisory services are offered through LPL Financial, a registered investment advisor. Member FINRA/SIPC.
LPL Tracking # 1136286