


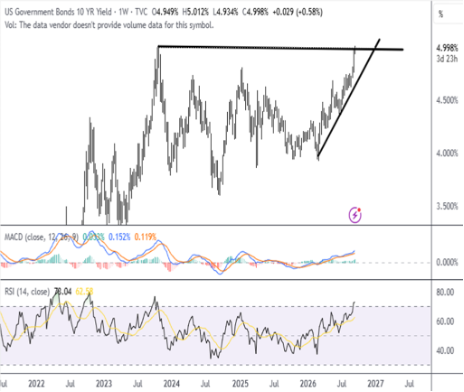
Last week came and went with the big interest rate decision by the recent Fed Chair Warsh. He raised short-term rates by a quarter. Did this change anything? Not really. Mr. Market had already adjusted in the bond area with interest rates rising to and eclipsing the 2007 highs. Is this a bad thing? Well, that depends if it is happening because there is a problem or is it happening because things are just really good. The jury is still out on the oil prices due to the conflict in the Middle East, but if we are to think that oil is the only thing driving inflation I think we are sadly mistaken. Clearly petroleum is a major component of the measure, but I believe that the underlying strength in the economy is really the driver.
If we are to forget all the reasons why prices are moving and simply look at the prices in general, what we have is the following:
- Currencies- the biggest market on the planet, shows the US Dollar gaining strength. This is due to the leading strength in our US economy as evidenced by most economic measures and undeniable corporate earnings.
- Bonds- interest rates are rising due to the unabated level of cash sloshing around the system, companies doing really well, and unemployment staying at very low levels. Hence, to prevent inflation from developing a level of momentum higher, preemptive hikes are occurring here and abroad.
Stock Markets- stock markets across the planet are sitting around all-time highs. Even though we have wars, oil shocks, political saber rattling, and pretty much anything else the media can blow out of proportion, earnings are growing at ferocious rates and forecasting still higher due to technological innovation.
Last week I found a very interesting statistic. It was brought out by Kobeissi Research platform (TKL Research), a global research platform on X. They stated that US Household net worth reached $185.7 Trillion. Just as I find the US debt at a number of $40 Trillion a very difficult number to fathom, I find this number even more difficult to fathom. What I could fathom was the fact that this number has surged $83.9 Trillion since the Pandemic, and that US household net worth has now risen for 11 consecutive quarters. Lastly, as a percentage of US GDP, household net worth rose +20% last quarter alone. Here is the long-term chart:
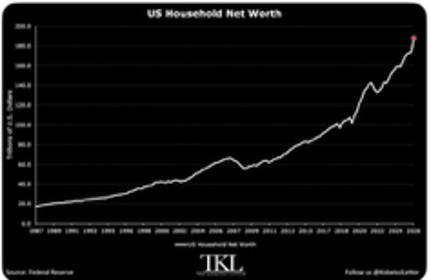
Again, the media is choosing to tell us we are on the precipice of disaster. If so, how could the numbers be so overwhelmingly consistent.
I want to come back to oil and the economy for a bit longer. I am doing this as the biggest cost component to the American consumer is gasoline. We need to get around, and if we have to spend too much on gas then we don’t have enough to spend on other items- both necessary and discretionary.
Contrary to the fears of gas prices gobbling up spending capacity, the resiliency of the US consumer was on display once again in August as retail sales rebounded from a fall in July by rising the most in five months. Looking at the details, the 1.2% headline advance was broad-based with eleven of the twelve major categories rising for the month. Gasoline stations contributed with a 3.1% increase, but that was driven by a rise in gasoline prices over the month and should not be interpreted as a boost in economic activity. The good news was that the modest 0.2% drop in building materials was the only major category to decline. We like to follow “core” sales, which strip out the volatile categories for autos, building materials, and gas stations and is important for estimating GDP. This measure rose 1.3% in August, and if unchanged in September, will rise at a 4.8% annualized rate in the third quarter versus the second quarter average. This is consistent with my view that third quarter real GDP is growing. Another bright spot in the report came from sales at restaurants & bars (the only glimpse we get at services in this report), which jumped 1.2% in August and has now shown healthy growth over the past five months. These across-the-board measures confirm our thoughts that the economy is strong across most all measures.
With the earnings backdrop still bullish for stocks and the macro picture holding up, it is tough to get too bearish, especially when seasonality turns positive after the first couple weeks of October, through year-end. I have been repeating week in and week out that this is a difficult period, and in fact, this week of September is historically, THE WORST WEEK OF THE YEAR! But could it be that instead of a dreaded and uncomfortable decline, we could (and we are) experience a sideways market in a tight range for an extended period time that eventually hits an oversold level that sparks a rally to new highs?
An interesting short-term stat that is setting the stage for this type of action is when an oversold reading in the short-term (percentage of companies trading above their 20-day and 50-day moving averages) hits a measurably low level, but the longer-term (percentage of companies above their 200-day average prices) stays in a positive uptrend. This tends to be a “pause that refreshes. This is measured graphically by looking at the price of the index and the relative strength index measures at the same time. This is what we are seeing currently:
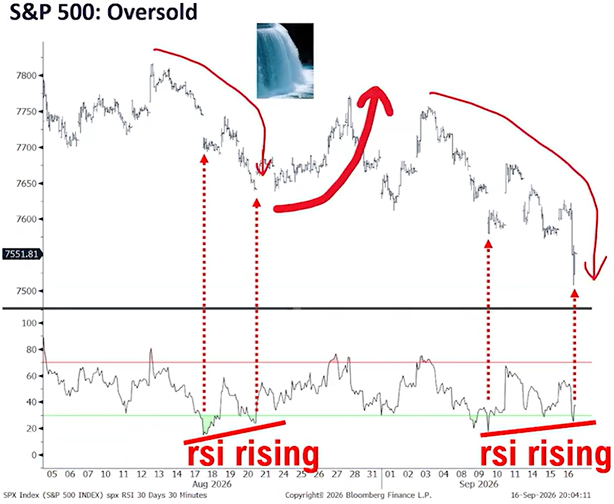
I don’t mean to blow the all-clear horn at this point, but I do feel that even though we remain in a difficult time of year, this difficult time could be dealt with by frustratingly moving sideways rather than declining and then recovering.
To end this week’s note on a more interesting point, I wanted to close with some historical facts on the El Nino weather pattern. I have collected this information over the last few weeks and found it tremendously interesting.
This Year’s Record-Breaking El Niño
With air and sea surface temperatures already breaking records, this year’s episode is on track to be the strongest in living memory. This year’s El Niño is already intense, and it’s not done growing. Scientists expect that by December, when El Niño events typically reach their peak, this one will wind up as the strongest in at least 80 years of precise record keeping. And perhaps as the most powerful in centuries.
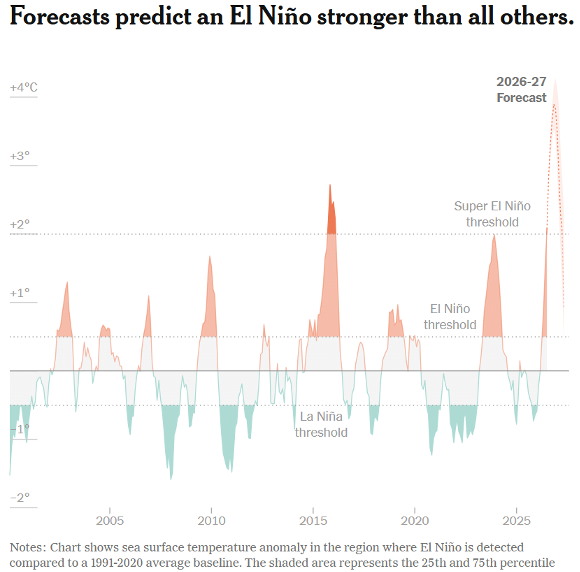
El Niños are essentially anomalies in the tropical Pacific Ocean. Their magnitude is measured by how far temperatures there rise beyond the norm. Temperatures must jump 2 degrees Celsius (3.6 degrees Fahrenheit) above average to qualify as a Super El Niño. But this year’s event is expected to go even further, well exceeding the prior strong El Niños that began in 1997, 2015 and 2023.
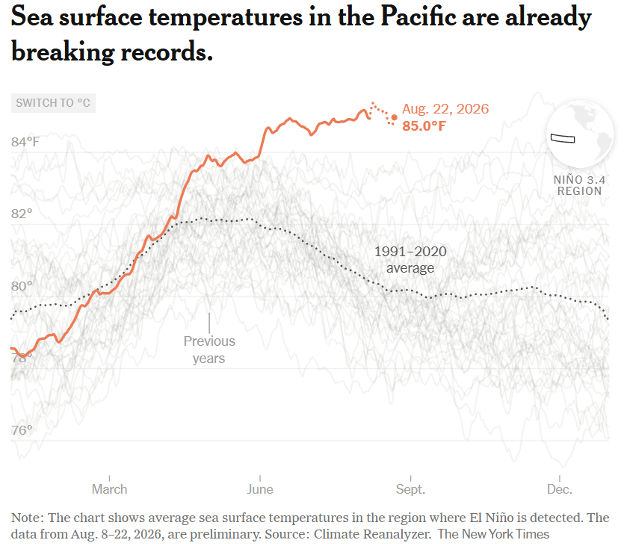
The heat that builds up near the surface of the tropical Pacific eventually makes the entire planet warmer. The trend takes a while to materialize, but recent El Niños have led to annual global heat records in the year after they form. To that end, scientists broadly expect 2027 to be the hottest year humans have ever experienced. But the heat is altering the trajectory of 2026 as well. The first half of this year, while broadly hotter than in previous decades, generally did not approach the heat records set in 2024. But recent days in August have been warmer than comparable dates in any prior year.
I realize that El Nino has little to do with investing and planning for retirement, but I did find this little snippet fascinating and timely to the weather patterns we are all dealing with. Poor yourself something refreshing and enjoy. What a year we are in!
-Ken South, Tower 68 Financial Advisors, Newport Beach
Important Disclosures:
The opinions voiced in this material are for general information only and are not intended to provide specific advice or recommendations for any individual. To determine which investment(s) may be appropriate for you, consult your financial professional prior to investing. All performance referenced is historical and is no guarantee of future results. All indices are unmanaged and cannot be invested into directly.
Investing involves risks including possible loss of principal. No strategy assures success or protects against loss. There is no guarantee that a diversified portfolio will enhance overall returns or outperform a non-diversified portfolio. Diversification does not protect against market risk.
The Standard & Poor's 500 Index is a capitalization weighted index of 500 stocks designed to measure performance of the broad domestic economy through changes in the aggregate market value of 500 stocks representing all major industries. The S&P 500 is a stock market index tracking the stock performance of 500 of the largest companies listed on stock exchanges in the United States. Indexes are unmanaged and cannot be invested in directly.
The Dow Jones Industrial Average is comprised of 30 stocks that are major factors in their industries and widely held by individuals and institutional investors.
The Nasdaq-100 is a large-cap growth index. It includes 100 of the largest domestic and international non-financial companies listed on the Nasdaq Stock Market based on market capitalization.
The NASDAQ Composite Index measures all NASDAQ domestic and non-U.S. based common stocks listed on The NASDAQ Stock Market. The market value, the last sale price multiplied by total shares outstanding, is calculated throughout the trading day, and is related to the total value of the Index. Indexes are unmanaged and cannot be invested in directly.
The Russell 2000 Index is an unmanaged index generally representative of the 2,000 smallest companies in the Russell 3000 index, which represents approximately 10% of the total market capitalization of the Russell 3000 Index.
Data sourced from Bloomberg (2025).
Stock investing includes risks, including fluctuating prices and loss of principal. No strategy assures success or protects against loss. There is no guarantee that a diversified portfolio will enhance overall returns or outperform a non-diversified portfolio. Diversification does not protect against market risk.
Bonds are subject to market and interest rate risk if sold prior to maturity. Bond values will decline as interest rates rise. Bonds are subject to availability, change in price, call features and credit risk.
Government bonds are guaranteed by the US government as to the timely payment of principal and interest and, if held to maturity, offer a fixed rate of return and fixed principal value.
Bond yields are subject to change. Certain call or special redemption features may exist which could impact yield.
International investing involves special risks such as currency fluctuation and political instability and may not be suitable for all investors.
Alternative investments may not be suitable for all investors and should be considered as an investment for the risk capital portion of the investor’s portfolio. The strategies employed in the management of alternative investments may accelerate the velocity of potential losses.
This information is not intended to be a substitute for specific individualized tax advice. We suggest that you discuss your specific tax issues with a qualified tax advisor.
The economic forecasts set forth in this material may not develop as predicted and there can be no guarantee that strategies promoted will be successful.
The financial professionals with Tower 68 Financial Advisors are registered with, and securities and advisory services are offered through LPL Financial, a registered investment advisor. Member FINRA/SIPC.
LPL Tracking # 1179155