


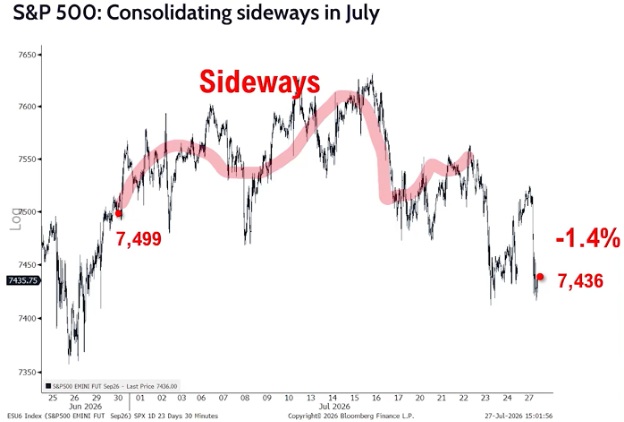
If you are on a witch hunt, and you can’t find any witches, you are upset and feel unaccomplished. Well, stocks simply don’t go up every day, but we are constantly on a witch hunt to find the culprit, the reason why, the issue that we didn’t consider, the problem “this time” that is surely the reason why prices have been a bit squishy. So, what is the “this time” this time? Well, it could be any of a number of issues. Hence, the broad markets aren’t really going up or down, they seem to be just sitting in a tight range. Here is a picture of the S&P 500. You can see that in the beginning of the year the markets were terrified of the war, so the market dropped. Then it recovered and screamed straight up due to earnings, contained disinflation, AI infrastructure build out, and US economic growth continuing to expand. Then it got to a point where it could be construed as fairly valued, so it takes a rest. It has been in this rest stage for the better part of two months.
This chart is a very short-term one, so it makes sense to put it in perspective by stretching out the time period and adding support and resistance bars to show where the prices of the S&P 500 could gravitate to. The S&P 500 still sits almost exactly where it did back in mid-May. The sideways grind has become even more pronounced recently, as it has just vacillated a bit below the 7500-pivot level. The key moving averages remain positively sloped, though they are narrowing amid the consolidation. The index failed to really follow through lower after falling below 7500 last week, but it hasn’t been able to sustain anything on the upside either. It will require a sustained break of either support or resistance to suggest the backdrop is changing. Here is the broader picture:
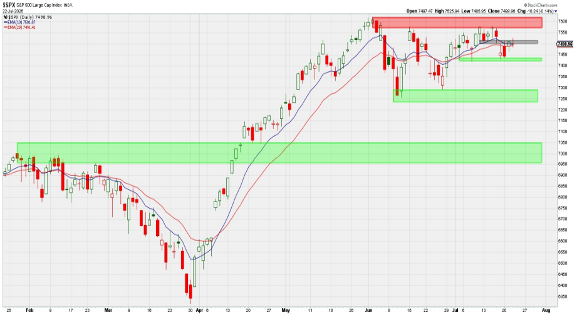
Since it is in this indecision state, many things have happened; no end to war in Iran, continued conflict in Ukraine / Russia, new Fed Chair with different style, huge expansion of AI, phenomenal earnings reports continuing, and the most statistically significant one- it’s a midterm election year. In this week’s note, I wanted to give the clear picture of where the broad market is currently, and then to go into what I believe is most important to focus on to get a better idea of what the runway going forward could look like.
The nemesis structurally (historically) has been the moves in the bond market and oil. If interest rates go higher then cost of capital increases. On the flip side of debt costs increasing, bonds become more attractive relative to stocks as the yields move up. This would not ordinarily be such a big deal as the true increase in interest rates has not been that major, but if stocks have been very strong for a while and the overall amount of debt outstanding is quite large, then it doesn’t normally take a big move in rates to cause stocks to decline. Here is where we sit currently with rates moving higher:
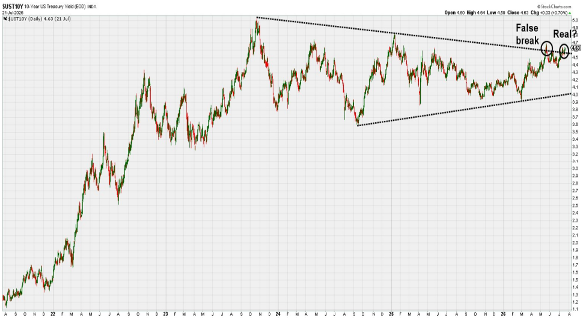
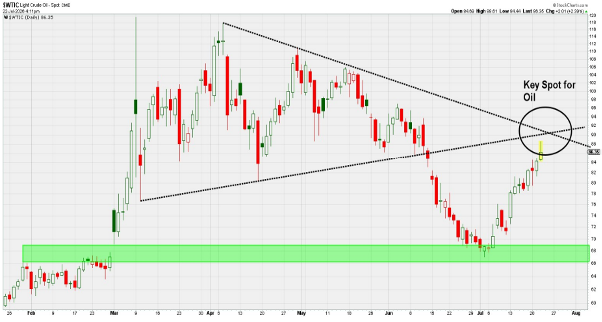
On top of the 10-year breaking above the old ceiling of 4.7%, we also see oil breaking back higher. I believe this is more a function of Ukraine destroying Russian oil refineries rather than the Straits of Hormuz still being frozen. Whatever the case, prices are higher, therefore gasoline and other distillates are higher, these are all inflationary and they all damage the purchasing power of the consumer. It becomes even more costly given that when oil prices rise, gasoline prices rise immediately. Yet, when oil prices decline, gasoline prices are slow to decrease and tend to not decrease as much on a percentage basis. Here is the price of oil:
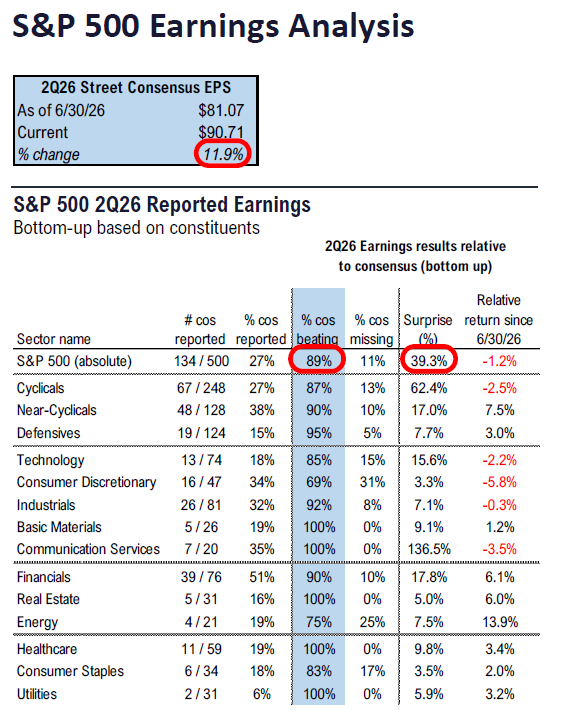
What I believe is holding the markets up even in the face of these negative current issues is earnings. So far, of the companies that have reported thus far for the second quarter, earnings have been terrific once again. 89% of the earnings that have been reported have been higher than expected, and higher by 39.3% above expectations. This is really quite large.
The bottom-line is that in spite of the tailwind of AI and technological innovation, the overall economy is not booming.
Consumption: Auto sales soared at a 22.3% annual rate in Q2 while “real” (inflation-adjusted) retail sales excluding autos rose at a 6.8% rate.
Business Investment: We estimate a 5.7% growth rate for business investment, with gains in equipment and intellectual property leading the way and commercial construction a continuing drag on growth (even including data centers, which are booming!).
Home Building: Residential construction looks to have been unchanged in the second quarter, which is a victory of sorts considering it has contracted in every quarter since 2024. We think this reflects a lack of workers to build homes while strict immigration enforcement makes more units available for rent.
Government: We are estimating that government purchases were still recovering in Q2 after the temporary shutdown of the federal government in the fourth quarter.
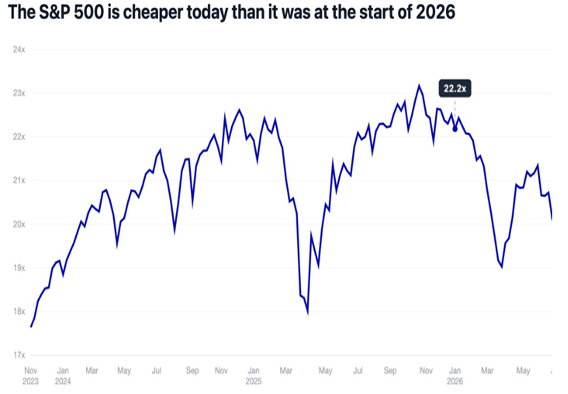
What continues to be quite baffling to me is that earnings are charging ahead and have been doing so for the better part of a year and a half, but prices as compared to earnings continues to show stocks getting cheaper and cheaper. This is almost unheard of. It would be logical that if earnings and forecasts are surprising to the upside, then prices should reflect this surprise by rising and they are not. This tends to imply that there are other factors having influence right now that we simply are not accounting for. It is just very strange that prices would not increase as earnings and forecasts are. I have to show this picture once again as it makes this blatantly obvious:
Earnings, interest rates, and oil are the evident fact that should be the drivers of the market, yet there are other statistical issues that should also be noticed and respected. The more important historical statistic is the midterm year issue. In looking at every midterm year since 1928, it is quite clear that the period from May to October has not been particularly friendly to markets, with the August to October period being the most negative. I’ve brought this up many times, but let’s take a closer look with updated measures of the current market’s progression overlayed on the statistical average:
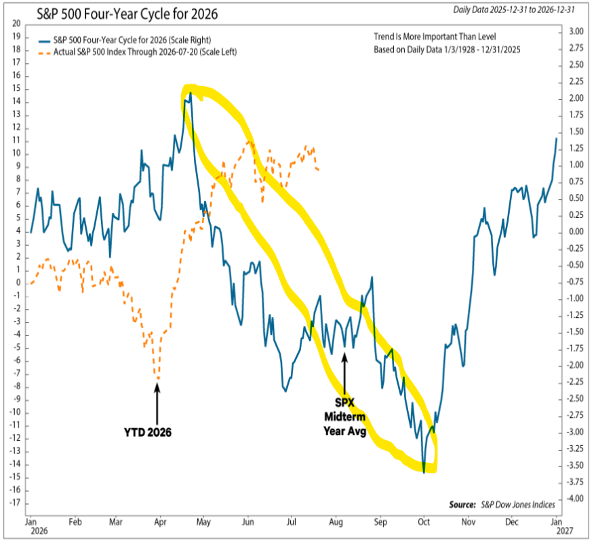
The S&P 500 has stalled over the past eight weeks, somewhat consistent with an anemic summer rally common in midterm years. The question moving forward is whether a second phase of weakness from mid-August to October is what we have in store. Our conclusion is that further consolidation is on the table, but this could greatly depend on the exit from the wars, inflation measures, earnings forecasts and AI company infrastructure spend. All the issues I have illustrated above. I know, it sounds like a lot, and it is! I believe this is why the market appears to be short-term directionless. The true problem is that there is sort of a two-sided market right now. Energy and utilities are very strong, and technology (which has been the leader) is very soft.
A few weeks back I brought up debt and debt defaults. Most specifically the spread between high-yield (higher risk) and US Government debt. The spread remains very tight. This is confirmed by the great earnings reports being seen. If we were to dig a bit deeper, we would look at the loan loss provisions that are being put in place by banks that do the lending. The loan reserves spiked during the Great Financial Crisis and the onset of COVID, but since then have remained quite muted. This could be why this midterm year could be one where the negative period could be more of a sideways move instead of a steep decline. I am not necessarily banking on this as I believe that a decline would be normal and ordinary given how long it has been since once has been experienced.
In closing, I wanted to show what we could expect after this midterm discomfort. As can be seen below, the calendar year following a midterm year has been a good one. Going all the way back to 1954, 18 out of 18 instances the markets have been higher and higher by a significant amount.
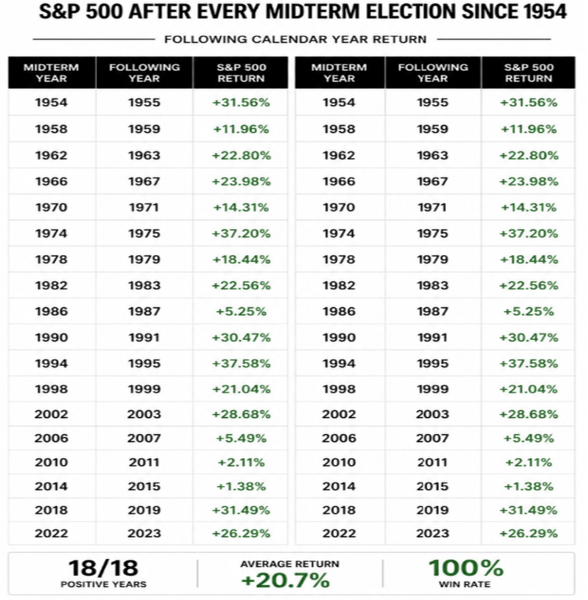
This chart looks good for the future, but it does little to help the situation we are in currently. We will work diligently to keep you abreast of the what the markets are doing and will be as timely as we are able to point out opportunities as they present themselves. For now, it is hot and humid on
Wall Street and ice cubes hardly have a chance.
-Ken South, Tower 68 Financial Advisors, Newport Beach
Important Disclosures:
The opinions voiced in this material are for general information only and are not intended to provide specific advice or recommendations for any individual. To determine which investment(s) may be appropriate for you, consult your financial professional prior to investing. All performance referenced is historical and is no guarantee of future results. All indices are unmanaged and cannot be invested into directly.
All information is believed to be from reliable sources; however LPL Financial makes no representation as to its completeness or accuracy.
Investing involves risks including possible loss of principal.
The Standard & Poor's 500 Index is a capitalization weighted index of 500 stocks designed to measure performance of the broad domestic economy through changes in the aggregate market value of 500 stocks representing all major industries. The S&P 500 is a stock market index tracking the stock performance of 500 of the largest companies listed on stock exchanges in the United States. Indexes are unmanaged and cannot be invested in directly.
The Dow Jones Industrial Average is comprised of 30 stocks that are major factors in their industries and widely held by individuals and institutional investors.
The Nasdaq-100 is a large-cap growth index. It includes 100 of the largest domestic and international non-financial companies listed on the Nasdaq Stock Market based on market capitalization.
The NASDAQ Composite Index measures all NASDAQ domestic and non-U.S. based common stocks listed on The NASDAQ Stock Market. The market value, the last sale price multiplied by total shares outstanding, is calculated throughout the trading day, and is related to the total value of the Index. Indexes are unmanaged and cannot be invested in directly.
The Russell 2000 Index is an unmanaged index generally representative of the 2,000 smallest companies in the Russell 3000 index, which represents approximately 10% of the total market capitalization of the Russell 3000 Index.
Data sourced from Bloomberg (2025).
Stock investing includes risks, including fluctuating prices and loss of principal.
Bonds are subject to market and interest rate risk if sold prior to maturity. Bond values will decline as interest rates rise. Bonds are subject to availability, change in price, call features and credit risk.
Government bonds are guaranteed by the US government as to the timely payment of principal and interest and, if held to maturity, offer a fixed rate of return and fixed principal value.
Bond yields are subject to change. Certain call or special redemption features may exist which could impact yield.
International investing involves special risks such as currency fluctuation and political instability and may not be suitable for all investors.
Alternative investments may not be suitable for all investors and should be considered as an investment for the risk capital portion of the investor’s portfolio. The strategies employed in the management of alternative investments may accelerate the velocity of potential losses.
This information is not intended to be a substitute for specific individualized tax advice. We suggest that you discuss your specific tax issues with a qualified tax advisor.
The economic forecasts set forth in this material may not develop as predicted and there can be no guarantee that strategies promoted will be successful.
The financial professionals with Tower 68 Financial Advisors are registered with, and securities and advisory services are offered through LPL Financial, a registered investment advisor. Member FINRA/SIPC.
LPL Tracking #1148907