


This week I am going to start with Thomas Lee’s six points as to why he believes the US equity markets are possibly going to do what is “not” expected this September. As you know, I have been giving the numerous reasons why this part of 2026 could be difficult for the stock markets of the world. But there is an old Wall Street adage that the markets will tend to do exactly the opposite of what the majority of prognosticators think it will do. Let me give you Thomas Lee’s list. I will break the points down more, then I will make a final comment on bonds, inflation, and subsequently interest rates, and then I will go into what I believe is the reason why this time the market has underlying earnings growth that should support the market during this difficult time and into yearend a sizable advance to new highs.
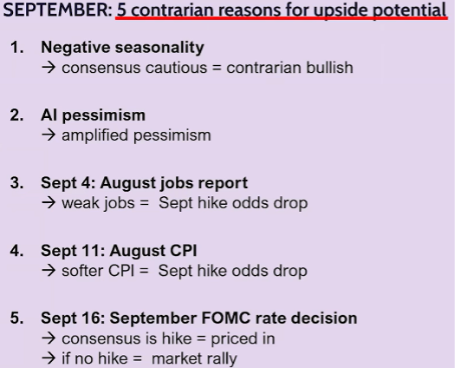
First are the seasonal negativities. As I stated above, I have gone into this in great detail the last few weeks, if you would like to refresh yourself with these, please go back and reread my report of August 25th.
AI pessimism. This to me is the most daunting. There is absolutely, undeniably, no question that AI and datacenters are a reality and the need for more of them as well as the infrastructure to power them is an almost unquenchable need. Also, there is zero question as to the way AI is already showing extreme promise in increasing productivity, decreasing fixed costs, decreasing labor costs, decreasing time to solve problems, increase margins, and add never before expected productivities. All of this at the same time being deflationary to the company as well as the ultimate consumer.
The political pushback is the issue that the markets seem to be having issues with. On both sides of the aisle, during the midterm election campaigning, it is clear that voting constituencies do not want datacenters or power plants in their back yards. These people running for office continue to posture that they are against the datacenters and power plants, but we all know that these comments are a fool’s errand and that they are going to be built and there are trillions of dollars that say that this is true. Also, it is clear that China is doing all in its power to spread rhetoric through social media channels that nobody wants or needs these and that in reality it is an AI Bubble, just so they can try and develop a lead against the United States in the race for AI.
Jobs Reports. As continued economic statistics come out it is being seen, just as it was with past economic / technological revolutions with the US that not only is AI not eating jobs but instead is creating such efficiencies and growth that companies are simply displacing good employees from one place to another so as to meet the need for their greater prosperity. So, no economic difficulties, no massive unemployment expansion, no inflation expansion, and massive earnings expansion for the foreseeable future.
The job market continues to defy fears of an AI-related job apocalypse. Nonfarm payrolls jumped 162,000 in August, beating even the most optimistic forecast by any Economics group on Bloomberg. Job growth in prior months was revised higher by 55,000 as well, erasing the prior negative reading for July. Meanwhile, civilian employment, an alternative yet volatile measure of jobs that includes small-business start-ups, rose 569,000, corroborating the strong headline number. Big picture, it looks like the US labor market has strengthened so far this year, with average monthly growth of 80,000 in 2026 versus just 20,000 in 2025.
August CPI. Virtually all measures of inflation are not showing runaway inflation. The focus of the inflationistas is, the war in Iran is forcing oil prices higher which implies higher prices and inflation at the pump, and the bond demon of a $40 Trillion US government debt load causes rates to go higher. Clearly rates are rising, and rising more than anyone would like, but as illustrated in the lead article in the Wall Street Journal last Wednesday, “Bond Rout Deepens Around Globe.” I have mentioned time and again about how the helicopter drop of money on the population of the world during the Great Financial Crisis, and then exponentially more during COVID has crippled debt markets across the globe. This is coming home to roost as I write this, with the biggest cracks being seen in Japan, the UK, and in Germany. The difference here in the US is we have an underlying economic engine that can support this debt.
September 16th FOMC rate decision. I do not believe that at the next Fed meeting next week that rates will be increased. There simply aren’t the economic statistics in place to support the need for a rate increase. This could quite possibly be a catalyst for markets to stop a sideways move and possibly rise. I believe that the rise could possibly hold off until the end of the dreaded month of September, but time will tell.
So, What's driving yields?
Investors have looked through higher yields for much of this cycle as strong earnings growth and a resilient economy offset the concern of higher rates. But with valuations elevated, AI spending becoming more debt-intensive, the national debt recently surpassing $40 trillion, and long-term Treasury yields approaching their highest levels in nearly two decades, the bond market has once again moved to the forefront for investors.
Since late 2024, the 10-year Treasury yield has climbed back toward the upper end of its range, currently sitting near 4.7% and near its highest reading since 2007. The rise in real yields was most responsible for the move higher, with the 10-year TIPS yield jumping from 1.5% in September 2024 to 2.4% today.
The underlying drivers of yields matter because each component has a different message about the economy. Rising real rates (the percentage interest above the rate of inflation) typically reflect stronger growth expectations and confidence in the economy. In contrast, rising inflation compensation suggests investors expect price pressures to remain more persistent over time. Persistent inflation can pressure equity valuations and profit margins, and call into question the durability of the expansion.
A higher rate for longer maturities indicates that investors are demanding additional compensation for owning long-duration bonds, which could be driven by uncertainty surrounding inflation, fiscal deficits, Treasury supply, Fed policy, or the broader macro-outlook. The most recent increase in yields appears to reflect renewed inflation concerns more than improving growth expectations. This negative environment and negative correlation environment has often occurred when inflation is a primary concern for investors. They key point for investors is: rising yields are interpreted as a threat to future growth rather than a signal of a healthy economy. The message from the current situation is that rising yields have become an increasingly stronger headwind for equities in recent months.
During periods when stocks have rallied as bond yields have risen (positive correlation), Consumer Staples, Utilities, REITS, and Health Care have had the most negative correlations with bond yields, and Financials has had the most positive correlation. This is what we are experiencing now as all of these are in a decline, exclusive of financials and some pharma / biotechs. Rising rates are viewed as a positive sign for the economy in these cases, supporting risk-on leadership. This would support eventual and continued growth in the price levels of technology stocks.
Bottom line
Rising yields, combined with excessive optimism and seasonality, suggest near-term weakness for equities is possible. Earnings will be a key factor for the duration and magnitude of any pullbacks. For now, the earnings outlook remains positive. In recent notes, I have explained that while earnings revisions have been strongest for Growth sectors, revisions have been positive across most sectors and industries. The trends support our base case of a year-end rally and the continuation of the bull market into 2027. A moderation in yield pressure would further strengthen that outlook. If Thomas Lee’s list of reasons why the Fed should not touch interest rates and if measures of inflation at the labor level and in the CPI consumer space remain contained, this could create a catalyst event at the Mid-September Fed meeting. The catalyst would be NO ACTION since the reasons for inflation to accelerate are abating.
At the same time, we have remained in the Tug-O-War situation where there is massive rotations amongst sectors and yet the markets have remained stuck in a range. How long should this continue? Until it ends. Could be bad, could be good. I believe that this is the subtle balance that is in place currently between inflation, earnings, and ultimately interest rates. When we throw on top these three geopolitical squabbles and midterm statistics, things are quite unsure and volatility could expand.
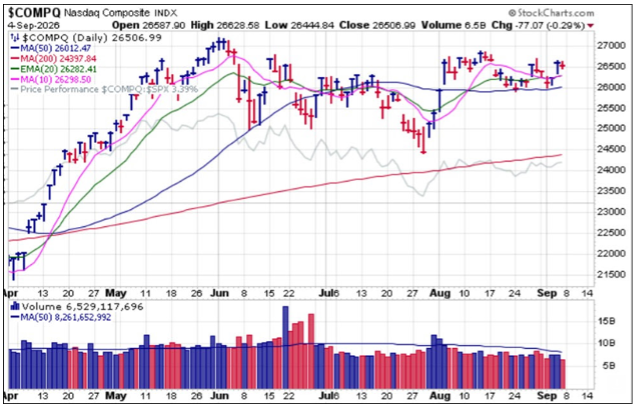
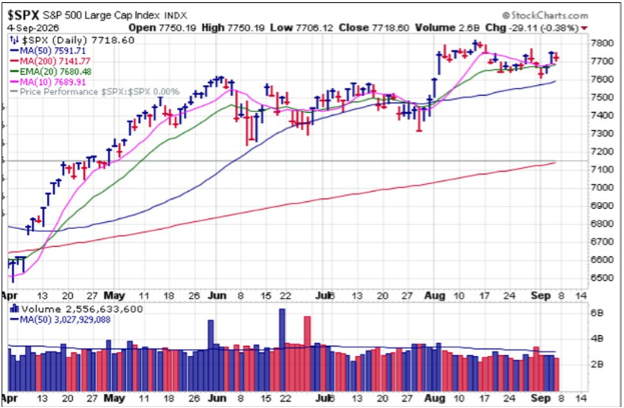
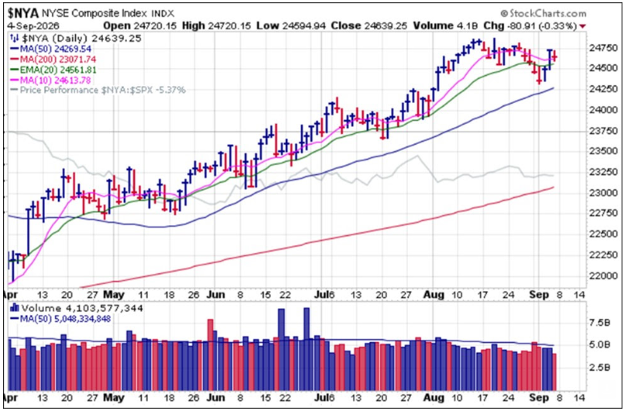
To see exactly what I mean, look below at the NASDAQ Composite, the S&P 500, and the much broader, NYSE Composite. The NASDAQ and S&P both have a large emphasis of their internal weightings to the technology heavy Magnificent 7, whereas the NYSE has a much broader list of heavy weight components. Notice how the NASDAQ and the S&P hit their highs in late May and have been in a tug-o-war ever since. I feel that this could possibly be a pause to refresh vs. a topping action. If September 26th’s lack of action holds true, this could be a bit of a launching pad.
Equities & Earnings, Glass Half Full or Half Empty
As Q2 earnings season winds down, the good news keeps rolling in from Corporate America. With 94% of S&P 500 companies reporting, 85.4% have exceeded consensus estimates. If the reading holds, it will be the third-highest beat rate on record, trailing only two quarters after the pandemic shutdowns. The pessimist would say that earnings are a series of mirages from one-time events and accounting gimmicks. Like the circular financing by the hyperscalers, skeptics would argue that paper profits are making earnings appear better than they really are. Consensus estimates are calling for 28.5% earnings growth through Q1 2027. Not only is that type of earnings growth rare, when it has occurred, it has happened in the early days of economic recoveries when profit margins are troughing, not in year seven of an expansion. I believe this is validation that AI is truly a technological revolution in the making and therefore it is permeating all industries positively.
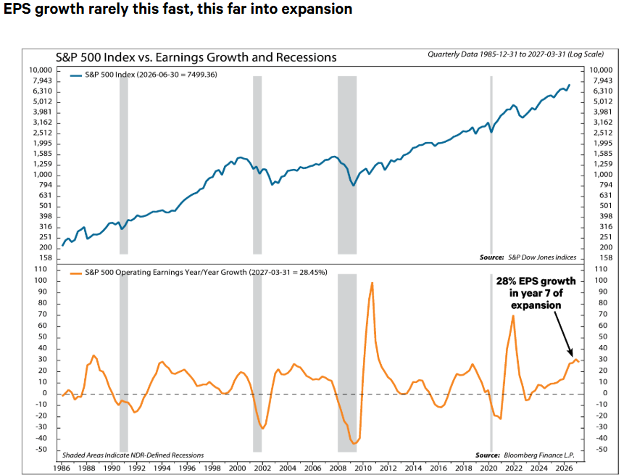
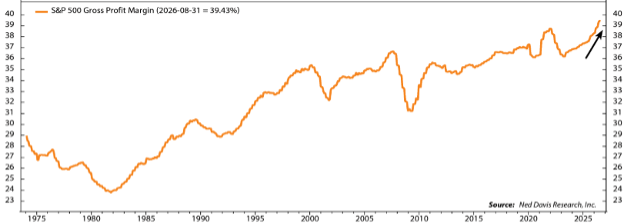
Another driver of earnings growth has been tariff refund checks. Many companies booked refunds as income in recent quarters, even if all the money has not been transferred from the government. Some firms booked the checks as a net benefit to operating income, therefore reducing costs of goods sold and boosting gross margins. The S&P 500 gross margin has soared 1.7% points in the past 12 months to a record high 39.4%. The chart above shows perspective on the annual operating earnings growth. Clearly the current situation is far from an outlier and could persist for longer than the boo birds would like!
Glass half full
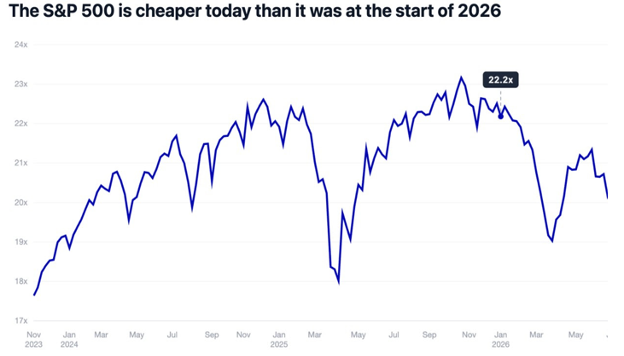
The optimist would say that investors are looking past some extraordinary items by pushing the forward P/E ratio down 3.0 points year-to-date to its lowest level of the year. An optimist would also note that sales growth has accelerated to 11.2%, its fastest pace since November 2022. This is almost unheard of. Markets across the board are moving higher and P/E ratios continue declining. See the chart of the progression of valuation as measured by P/E ratio, followed by the AI induced gross profit margin expansion:
There is really only one way to explain the increase in S&P 500 gross profit margin, and that is the influence of AI.
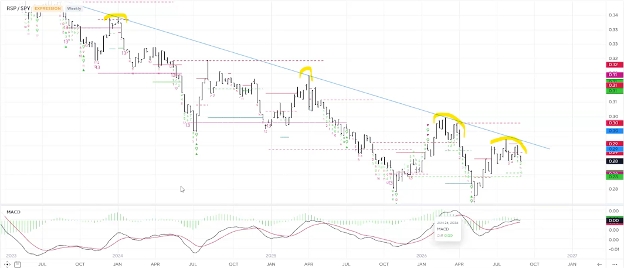
In closing, I want to show Mark Newton’s slide from last week showing how the Equal Weighted S&P is acting relative to the more widely followed Cap Weighted S&P. From the late May highs of the S&P 500 it can be seen that the markets broadened, technology took a short-term beating, and the Equal Weighted Index began to show relative strength. As of last Friday’s market, action, technology has reengaged and this downtrend looks ready to reengage to the downside as it did in late 2023, April of last year, and in the blastoff period for tech that began in March of this year. The next few weeks could quite possibly be a catalyst if not last weekend’s release of Open AI’s newest model, “Chat GPT 6.0.”
-Ken South, Tower 68 Financial Advisors, Newport Beach
Important Disclosures:
The opinions voiced in this material are for general information only and are not intended to provide specific advice or recommendations for any individual. To determine which investment(s) may be appropriate for you, consult your financial professional prior to investing. All performance referenced is historical and is no guarantee of future results. All indices are unmanaged and cannot be invested into directly.
Investing involves risks including possible loss of principal. No strategy assures success or protects against loss. There is no guarantee that a diversified portfolio will enhance overall returns or outperform a non-diversified portfolio. Diversification does not protect against market risk.
The Standard & Poor's 500 Index is a capitalization weighted index of 500 stocks designed to measure performance of the broad domestic economy through changes in the aggregate market value of 500 stocks representing all major industries. The S&P 500 is a stock market index tracking the stock performance of 500 of the largest companies listed on stock exchanges in the United States. Indexes are unmanaged and cannot be invested in directly.
The Dow Jones Industrial Average is comprised of 30 stocks that are major factors in their industries and widely held by individuals and institutional investors.
The Nasdaq-100 is a large-cap growth index. It includes 100 of the largest domestic and international non-financial companies listed on the Nasdaq Stock Market based on market capitalization.
The NASDAQ Composite Index measures all NASDAQ domestic and non-U.S. based common stocks listed on The NASDAQ Stock Market. The market value, the last sale price multiplied by total shares outstanding, is calculated throughout the trading day, and is related to the total value of the Index. Indexes are unmanaged and cannot be invested in directly.
The Russell 2000 Index is an unmanaged index generally representative of the 2,000 smallest companies in the Russell 3000 index, which represents approximately 10% of the total market capitalization of the Russell 3000 Index.
Data sourced from Bloomberg (2025).
Stock investing includes risks, including fluctuating prices and loss of principal. No strategy assures success or protects against loss. There is no guarantee that a diversified portfolio will enhance overall returns or outperform a non-diversified portfolio. Diversification does not protect against market risk.
Bonds are subject to market and interest rate risk if sold prior to maturity. Bond values will decline as interest rates rise. Bonds are subject to availability, change in price, call features and credit risk.
Government bonds are guaranteed by the US government as to the timely payment of principal and interest and, if held to maturity, offer a fixed rate of return and fixed principal value.
Bond yields are subject to change. Certain call or special redemption features may exist which could impact yield.
International investing involves special risks such as currency fluctuation and political instability and may not be suitable for all investors.
Alternative investments may not be suitable for all investors and should be considered as an investment for the risk capital portion of the investor’s portfolio. The strategies employed in the management of alternative investments may accelerate the velocity of potential losses.
This information is not intended to be a substitute for specific individualized tax advice. We suggest that you discuss your specific tax issues with a qualified tax advisor.
The economic forecasts set forth in this material may not develop as predicted and there can be no guarantee that strategies promoted will be successful.
The financial professionals with Tower 68 Financial Advisors are registered with, and securities and advisory services are offered through LPL Financial, a registered investment advisor. Member FINRA/SIPC.
LPL Tracking # 1171916