


Investors might feel like they are continuously being pummeled by the new this year. But the S&P 500 reached a new high on last Tuesday. The most convincing bull case for U.S. stocks is that geopolitics and international relations are, as so far this year, just noise.The signal that matters comes from earnings.Following the progression of earnings going all the way back to 2018, simply look at the forecasts and the reported numbers in the graph below. Clearly there is a reason why the markets have remained strong- stronger than normal for an unquenchable period of time. Pay particular attention to the consistent increase since 2022 when interest rates stopped going up and the effect of the Helicopter money from COVID worked its way into the system.
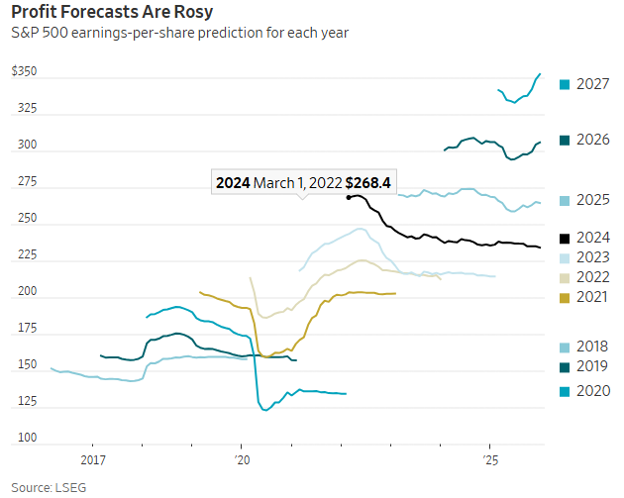
Since earnings have been great, and are forecast to be greater still, all’s good so long as the economy remains ebullient as it has. Believers should expect the rally to continue to broaden out beyond the Big Tech artificial-intelligence names. Any more dips following Trump tweets create buying opportunities when others panic. There are other arguments in favor of the bull case. A decent economy and the prospect of lower interest rates if inflation comes back under control underpin the strong earnings predictions. With a bit more than a 10th of fourth-quarter earnings reports in for the S&P in recent weeks, companies are producing even stronger earnings than expected—with many dominant tech companies due to report this week.
The consensus of analysts is for S&P 500 earnings to rise 15% this year and another 15% next year, after 13% last year, which would be the first three-year run of double-digit earnings growth since before the financial crisis in 2008. I believe that this is an EARNINGS backdrop that provides a wide array of reasons for higher prices.
Bullish barometer
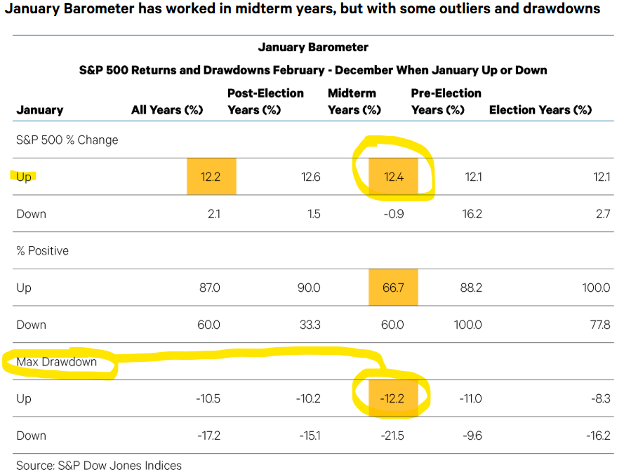
The S&P 500 gained 1.4% in January, triggering a bullish signal from the January Barometer. Since 1950, when the S&P 500 has risen in January, the index has gained an additional 12.2% in the final 11 months of the year versus just 2.1% when it has fallen in January.
The only fly in the ointment is that it is a midterm year, and these midterm years tend to not be particularly friendly to markets. Midterm years are infamous for their weak returns. The S&P 500’s average gain of 4.6% during midterm years is the weakest of the four years in the Presidential Cycle. Combining the two, midterm years with January Barometer bullish signals have ended well. The February – December average gain of 12.4% is in line with the other three years. In the chart below, Ned Davis Research points out this high probability of positive outcome. But wait, not so fast! Please also note that there tends to be a draw down as well during these 12.4% up years. This is an average of a 12.2% drawdown. See the chart below:
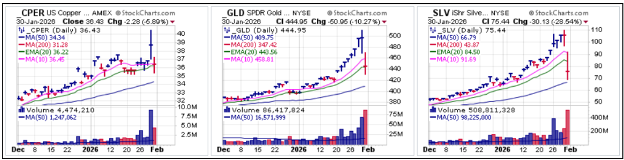
Seasonal studies like the January Barometer and midterm tendencies are helpful guideposts, but we pay closer attention to the messages from our indicators and models. Perhaps the defining characteristic of January 2026 was the violent rotations within equities and in commodities. If you happened to be sleeping for the last week you would have missed the drop in one day last Friday in silver. Silver was the primary victim of the sell-off, imploding around 31% on Friday alone for its worst day since 1980. From the Thursday high in the futures, the total collapse in silver was an astonishing ~38%. And an almost equally eviscerating move in Gold and Copper! As it stands, it is appearing that this rotation in stocks was money moving from the Magnificent 7 to other parts of the market.
The Federal Reserve held rates unchanged at the first meeting of 2026, while it waits to see what direction inflation, employment, and other policies take in the months ahead. Starting with the Fed statement, the most significant language changes suggest stronger economic fundamentals. Economic growth was categorized as “solid,” an upgrade from the prior characterization of “moderate.” The unemployment rate has “shown some signs of stabilization” (the last Fed statement noted the unemployment had edged up over the prior months). On the inflation front, comments that inflation had moved up since earlier in the year were struck from today’s statement and now simply reads that inflation “remains somewhat elevated.”
Q4 earnings season hit high gear last week and markets have a lot to digest. Beyond the headline earnings and guidance numbers, investors are also looking for clarity on the earnings impacts of the evolving trade landscape as well as clues regarding the trajectory of AI capital investments. It seems like the dominoes are falling sort of like this:
- AI investments in hardware to build the back end of AI crunching.
- Deploying software to the AI data so that the data is digestible by companies for their specific benefits.
- Which companies are showing the greatest benefits to bottom line earnings by using AI?
Earnings could help solidify the rotation away from Growth to Value if growth rates and revision trends continue to suggest a broadening beyond the tech mega-caps later this year. Conversely, a strong quarter from the mega-caps could help Growth sectors regain leadership status. We are currently experiencing a very strange phenomenon. Over 60% of the stocks in the S&P 500 are performing better than the index. This is rare. And, unfortunately, 3 out of 4 times, this has precipitated a general market decline since 1975. The general level of the pullback is 11.1% (this is data provided by Ned Davis Research January 27, 2026).
For Q4, analysts expect Technology to do most of the heavy lifting. The sector is expected to register the highest growth rate at 22% and contribute more than half of the expected 12% earnings growth rate for the S&P 500 in the quarter. Financials (2.0%), Communication Services (1.5%), and Health Care (1.2%) are the next largest contributors, with all other sectors forecasted at less than 1.0%. This is why there tends to be so much focus on the big tech leaders.
The supposed importance news of a possible new Fed Chairman
Apparently, Kevin Warsh desperately wanted to become Fed Chair. Having earned a reputation as an inflation hawk during his time as Fed governor, how did Warsh ingratiate himself to Trump? He followed a five-step process:
- Tap your political connections. Strengthen your personal ties with Trump and his administration. This gave Warsh a big advantage over Rieder and Waller.
- Declare the economy is undergoing a productivity boom, which will boost growth and contain inflation. This wasn’t a big ask, as many people (ourselves included) believe in the promise of AI and other new technologies.
- Support the development of cryptocurrencies. The rules are still being written without you, so throwing your support behind it is a low-risk strategy.
- Advocate for lower rates. You know Trump wants lower rates, so tell him what he wants to hear.
- Double down on shrinking the Fed’s balance sheet further, replacing reserves with stablecoins, and perhaps moving back to a scarce reserves regime.
It’s this last item that allows Warsh to defend his inflation-fighting credentials and preserve Fed independence. While lowering rates is like stepping on the gas (since it makes money cheaper so people and companies will borrow more), shrinking the balance sheet is akin to tapping the brakes (if the Fed takes money out of the system this is a form of tightening). If done simultaneously, it results in a cloud of smoke, higher rate volatility, and a reduction in household affordability.
Clear and compelling communication from Warsh will be critical. The bond market is already somewhat skeptical, with the term premium elevated but still generally below the levels seen around the Great Financial Crisis.
The equity markets, however, like liquidity (lower interest rates and a continued flow of funds) and won’t be thrilled with the idea of shrinking the balance sheet. The bond market, in particular, may test the new Fed Chair early on, as it has done with other freshly appointed chairs.
In our study of past newly appointed Fed Chairs back to 1970, we found that 10-year Treasury yields were always higher in the months leading up to the new Fed Chair (except for 1979). They also continued to rise in the three months after they took over.
This is important as this could cause another reason for concern in an upward equity market. According to what is normally a very positive Thomas Lee at FundStrat, he actually sees a period of time that could be a bit difficult going into Midterm elections:
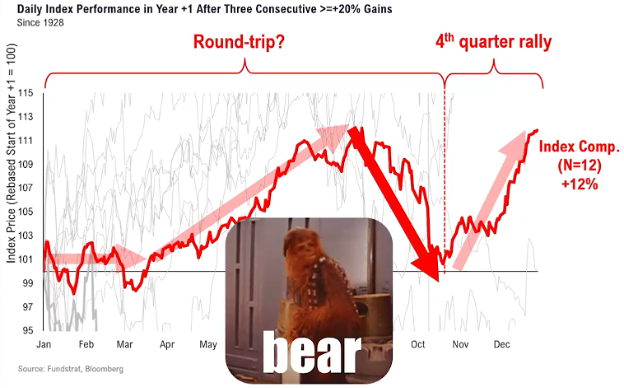
You will notice that this is the same year end number as historically has been the case from the Ned Davis data that I began this piece with. The decline also dovetails with the normal “drawdown” that has been experienced in Midterm years past that were positive in the end.
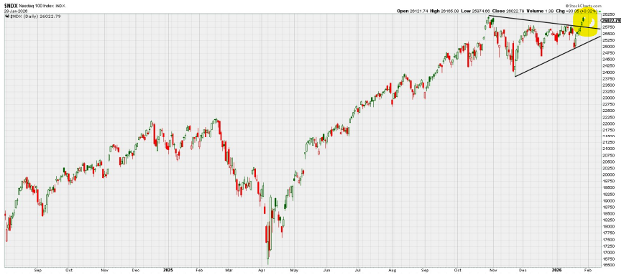
 Do we have to have a draw down? I believe it could be equally as likely that the market simply rotate between sectors, and this could serve as a digestive action as well. If we are to look at the inflation measures so far, they are following an almost perfect rhyme to inflation figures of the 60’s through the 80’s. Last week’s Producer Price Index seems to suggest this rhyme continuing. Inflation may be on the rise at the producer level, but AI, labor and wage rates could keep this tamped down at the consumer level. Notice that the leading index for the last few years has been the NASDAQ, and since September it has gone nowhere. Not down, just nowhere. This doesn’t mean that there can’t be a decline, but if the earnings progression of the big tech companies continue to be strong, this could contain any type of decline.
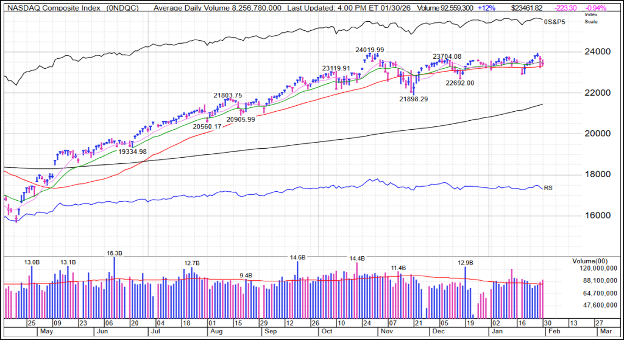
Where did the January rally come from and is this a good thing?
The January barometer is the January barometer, but looking under the hood is of utmost importance as well. This year is very different than the strong years seen since the October of 2022 lows. One of the most glaring is that this year over 60% of the companies in the S&P 500 have come out of the blocks stronger than the index in the month of January. This statistically has not been a good omen. When this has happened in the past, the index tends to have a digestion of around 10%. Another point is when the leading sector is consumer staples (a highly defensive sector) this has tended to precipitate a digestive phase as well. Please keep this in mind. And remember my favorite chart showing that fairly often (3-4 times per year) there is a 5% correction and about once a year there is a 10% plus drawdown.
As always, I don't spend much time worrying about the "reasons" behind moves. A reasonable narrative can always be created to explain why the market does what it does. I am more focused on the current action and if it fits with the narrative of historical precedent that tends to increase probability of an expected outcome. So where does that leave us? For the stock market, we still do not have the same kind of strong evidence to suggest the potential top of the rally has been made. No major support has fallen in the indices, and the S&P 500 was just at an all-time high just last week. At the same time, though, I would not call the recent action all that inspiring. The broad market has weakened over the past couple of weeks and, to repeat, the inability of the S&P 500 to definitively break higher suggests the smart money is using these new highs to exit positions. The breakdown in the leading stocks to end the week has the makings of the "canary in the coal mine" indicator. But even this has begun to reengage and move higher.
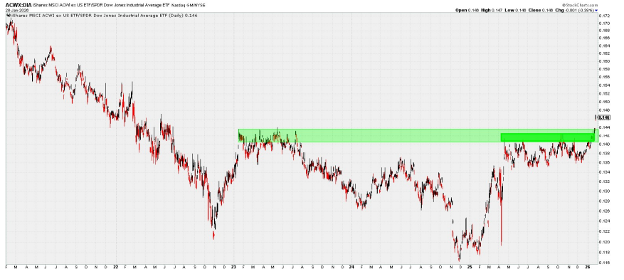
In closing, where I am really seeing some action is in the rest of the world EX-US. I think it's worth highlighting again that the iShares MSCI All Country World Index (Ex-US) ETF is breaking out to multiyear highs against the Dow Jones Industrial Average. While there's no guarantee that the outperformance continues, the action does look a potential major bottom following many years of consistent outperformance by U.S. stocks. If we have begun a new secular trend, world stocks could outperform U.S. stocks over the next several years. This is still to be seen and if it is real, then there will be plenty of time to shift.
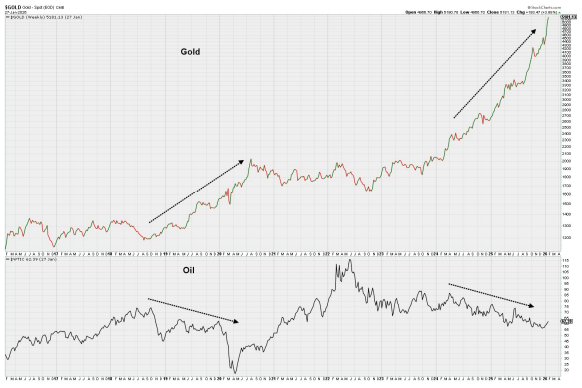
The other place that is starting to look pretty interesting is the oil patch. If we simply think about Trump’s “Drill baby drill” coupled with Venezuela and Iran, Oil could be a pretty big focal point going forward after years of sleepiness:
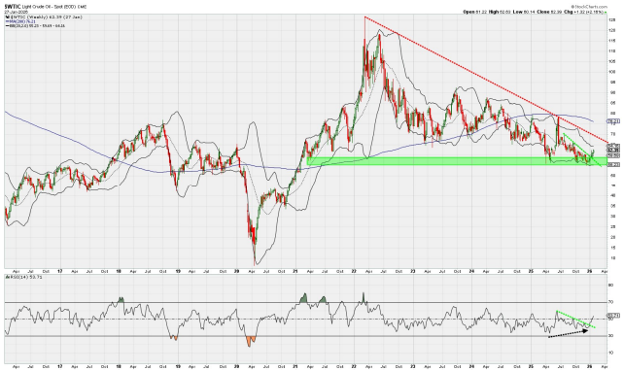
I know it’s hard right now to get anyone to focus on Oil when Gold/Silver are doing what they are doing. However, while the metals are in the middle of a once-a-generation kind of move, there is some recent history that supports that Gold might be setting the stage for Oil. We saw Gold go on a big run back in 2018-2020 while Oil consistently slumped. However, Gold then spent the next two years cooling off, while Oil made a big run up above $100 of its own. No guarantees that happens again, of course, but the opening is now there with Oil hooking up in bullish fashion.
Needless to say, there is a lot going on. We will continue to pay attention and participate where we feel it is appropriate to do so. Please feel free to send any and all questions in that you may have.
- Ken South, Tower 68 Financial Advisors, Newport Beach
-
Get Ken's Weekly Market Commentary Delivered To Your Inbox!
Important Disclosures:
The opinions voiced in this material are for general information only and are not intended to provide specific advice or recommendations for any individual. To determine which investment(s) may be appropriate for you, consult your financial professional prior to investing. All performance referenced is historical and is no guarantee of future results. All indices are unmanaged and cannot be invested into directly.
All information is believed to be from reliable sources; however LPL Financial makes no representation as to its completeness or accuracy.
Investing involves risks including possible loss of principal.
The Standard & Poor's 500 Index is a capitalization weighted index of 500 stocks designed to measure performance of the broad domestic economy through changes in the aggregate market value of 500 stocks representing all major industries. The S&P 500 is a stock market index tracking the stock performance of 500 of the largest companies listed on stock exchanges in the United States. Indexes are unmanaged and cannot be invested in directly.
The Dow Jones Industrial Average is comprised of 30 stocks that are major factors in their industries and widely held by individuals and institutional investors.
The Nasdaq-100 is a large-cap growth index. It includes 100 of the largest domestic and international non-financial companies listed on the Nasdaq Stock Market based on market capitalization.
The Russell 2000 Index is an unmanaged index generally representative of the 2,000 smallest companies in the Russell 3000 index, which represents approximately 10% of the total market capitalization of the Russell 3000 Index.
Data sourced from Bloomberg (2025).
Stock investing includes risks, including fluctuating prices and loss of principal.
Bonds are subject to market and interest rate risk if sold prior to maturity. Bond values will decline as interest rates rise. Bonds are subject to availability, change in price, call features and credit risk.
Government bonds are guaranteed by the US government as to the timely payment of principal and interest and, if held to maturity, offer a fixed rate of return and fixed principal value.
Bond yields are subject to change. Certain call or special redemption features may exist which could impact yield.
International investing involves special risks such as currency fluctuation and political instability and may not be suitable for all investors.
Alternative investments may not be suitable for all investors and should be considered as an investment for the risk capital portion of the investor’s portfolio. The strategies employed in the management of alternative investments may accelerate the velocity of potential losses.
This information is not intended to be a substitute for specific individualized tax advice. We suggest that you discuss your specific tax issues with a qualified tax advisor.
The economic forecasts set forth in this material may not develop as predicted and there can be no guarantee that strategies promoted will be successful.
LPL Tracking #1059277