


Rate cuts are supposed to ease financial conditions and encourage credit growth. But we already have both in spades. Financial conditions today are easier than when the Fed began hiking, and demand for yield is so strong that junk bonds trade nearly in line with investment-grade credit. In this environment, easier money risks fueling “fiscal dominance” and inflation expectations. Below is the picture of this spread. I think this is super important to look at as it provides us the opportunity to recognize when credit is becoming challenging and the cost for higher risk debt rises while US Government debt remains pretty much a constant:
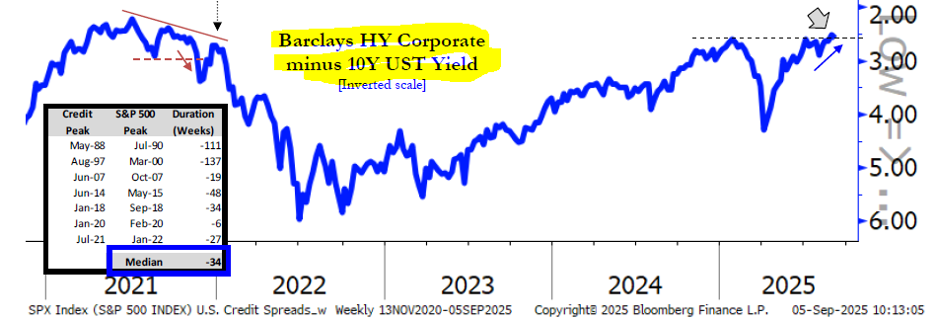
I begin this week’s note with this as this is an extremely important concept. I mean think about it. If the economy is having issues, then credit should reflect this. But in this case, the ONLY issue that is being bantered about within the domestic economy is labor. Last Friday’s employment numbers were said to be “all that is needed” for the Fed to lower rates on the 17th of this month. But do they? GDP is strong, wages are solid. The industrial numbers of PMI are solid. So is it strange that employment is being challenged? I think not. There seems to be a tug-o-war going on presently between jobs available due to the immigration crack down, and at the same time numerous layoffs due to AI taking the place of many jobs.
This is a very uncommon situation indeed as it has been a very long time since immigration was an issue, and never before a time when AI even existed! We do not expect any dramatic cuts from the
Fed but rather measured trims that exemplify its sensitivity to practicing its dual mandate to nurture economic growth toward full employment without untoward levels of inflation. On the release of the numbers last week, the broad market rallied at first and then weakened as traders and investors considered what two successive disappointments (both the July and August non-farm payrolls reports) might portend in terms of economic growth and the markets.
So, what’s the market telling us?
In our view, the equity market digested the previous non-farm payroll number for the month of July (with expectations for a number of 105,000 jobs added faced with an actual number of 73,000 and with revisions to two prior months) with relative ease: the S&P 500 shed just 1.6% on the day (Aug. 1) that the number was released. After exhibiting some wonkiness, it then managed to rally some 4.2% to its latest record high of 6502 reached last Thursday (September 4).
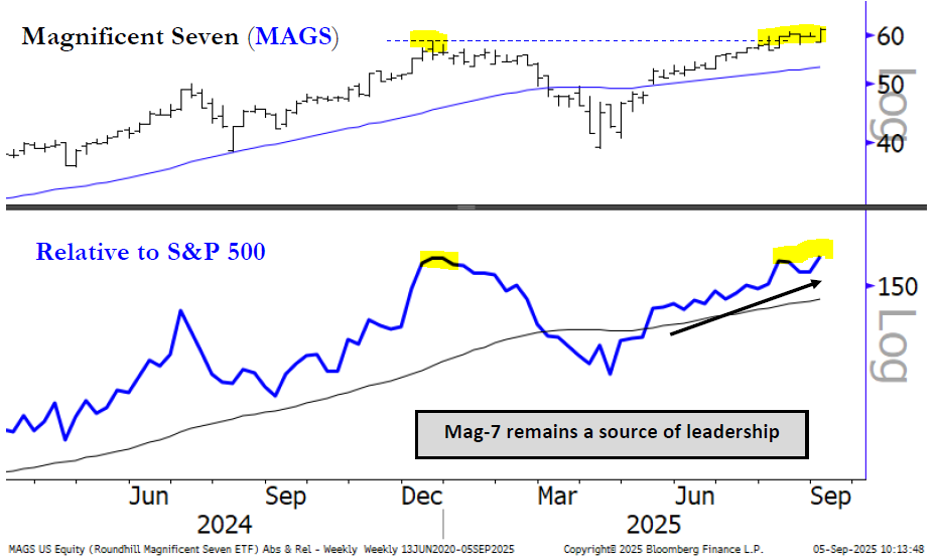
In looking at what is driving the markets, or pulling the prices up as it may be, I still believe that the strongest horses are the Magnificent 7 companies that have been at work in this action since the end of 2023. They continue to not only rise to new highs but also continue to lead verses a comparison to the overall S&P 500 Index. Although this doesn’t happen in a straight line, as soon as a couple of the seven take a breather, it almost appears that the baton is passed to the others, and this allows this group collectively to continue moving higher.
As can be seen below, the Mag 7 hit an absolute high in December, pulled back with the markets in April, and have since now broken to new highs much like the overall market. But relative to the broad index itself, this select group has now again regained its overall leadership:
The most important chart in this week’s note to keep on your desk and in your mind is that of the seasonal expectations for the overall S&P 500. As I often like to combine the one-year seasonal cycle, to the four-year presidential cycle, and the ten-year decennial cycle, and then compare it to the current year, this gives us an indication of exactly where we stand based on history. September is a weak month seasonally, and then the markets tend to get back on their horses and ride into year end. If you happen to wonder why September tends to be such a bad month, it is because this tends to be the beginning of the new year for the schools. In the olden days it was said that the traders were closing up their homes in the Hamptons for the summer and getting their kids set up for the new school year and hence took their money to the sidelines until the beginning of October.
 In closing, I thought I would show you where unemployment currently is going back to the early 2000’s. You can see the unemployment spikes during the Great Financial Crisis and COVID, but of late initial unemployment claims seem to remain quite muted. I bring this up as this is what the media has been tending to focus on with the supposed need for the Fed to ease interest rates. I believe that they could, as it has been some time since the last ease, but other than the last couple of months’ employment data, the economy remains quite robust.
 Please take a moment and refresh your expectations for the economy and the real reason why interest rates should be adjusted. As you will find, it might make it better for business, but exclusive of major policy decisions, longer-term interest rates might rise as a result and this could make things a bit difficult next year.
- Ken South, Tower 68 Financial Advisors, Newport Beach
-
Get Ken's Weekly Market Commentary Delivered To Your Inbox!
Important Disclosures:
The opinions voiced in this material are for general information only and are not intended to provide specific advice or recommendations for any individual. To determine which investment(s) may be appropriate for you, consult your financial professional prior to investing. All performance referenced is historical and is no guarantee of future results. All indices are unmanaged and cannot be invested into directly.
All information is believed to be from reliable sources; however LPL Financial makes no representation as to its completeness or accuracy.
Investing involves risks including possible loss of principal.
The Standard & Poor's 500 Index is a capitalization weighted index of 500 stocks designed to measure performance of the broad domestic economy through changes in the aggregate market value of 500 stocks representing all major industries. The S&P 500 is a stock market index tracking the stock performance of 500 of the largest companies listed on stock exchanges in the United States. Indexes are unmanaged and cannot be invested in directly.
The Dow Jones Industrial Average is comprised of 30 stocks that are major factors in their industries and widely held by individuals and institutional investors.
The Nasdaq-100 is a large-cap growth index. It includes 100 of the largest domestic and international non-financial companies listed on the Nasdaq Stock Market based on market capitalization.
The Russell 2000 Index is an unmanaged index generally representative of the 2,000 smallest companies in the Russell 3000 index, which represents approximately 10% of the total market capitalization of the Russell 3000 Index.
Data sourced from Bloomberg (2025).
Stock investing includes risks, including fluctuating prices and loss of principal.
Bonds are subject to market and interest rate risk if sold prior to maturity. Bond values will decline as interest rates rise. Bonds are subject to availability, change in price, call features and credit risk.
Government bonds are guaranteed by the US government as to the timely payment of principal and interest and, if held to maturity, offer a fixed rate of return and fixed principal value.
Bond yields are subject to change. Certain call or special redemption features may exist which could impact yield.
International investing involves special risks such as currency fluctuation and political instability and may not be suitable for all investors.
Alternative investments may not be suitable for all investors and should be considered as an investment for the risk capital portion of the investor’s portfolio. The strategies employed in the management of alternative investments may accelerate the velocity of potential losses.
This information is not intended to be a substitute for specific individualized tax advice. We suggest that you discuss your specific tax issues with a qualified tax advisor.
LPL Tracking #794843