


As 2025 comes to a close, I reflect on what is in place that could provide a positive backdrop for 2026. The one point that keeps ringing true is the age-old axiom, “NEVER FIGHT THE FED.” I pay a lot of attention to this as the Fed provides the access to fuel (available money) that fuels most all market advances. To sort of follow the bouncing ball, it goes like this:
- Evaluate the economy: is it in an expansion or a contraction? Right now, as evidenced by the very robust third quarter GDP report the US economy is in an expansion mode.
- How are earnings for companies relative to expectations and how are they forecasting future earnings? At present, earnings and revenues are coming in better than expectations from Wall Street analysts, and forecasts are being raised. Again, very good testament to the state of the economy.
- What is the Fed doing with interest rates? Currently, since September, they have been lowering them steadily. At the same time evaluating labor and inflation readings to see if the economy is not overheating. At present, inflation is falling and labor is in a slow decline, mainly attributed to the proliferation of AI.
- Equity markets both here and abroad are reflecting points 1-3 above.
The biggest concern currently is AI. Since this is a very new and difficult to measure technological advancement, the number one fear is overcapacity. This overcapacity concern is a credible path to feared / possible AI bubble “pop,” over the next few years, triggered when utilization, pricing, and capex guidance finally force investors to mark expectations back to reality. Prediction markets say 1/3 chance of a burst by end of 2026 (2/3 chance no burst, bull market continues). I believe this is why Fed rate cuts may continue and therefore cheaper capital could provide the necessary fuel for continued global equity growth.
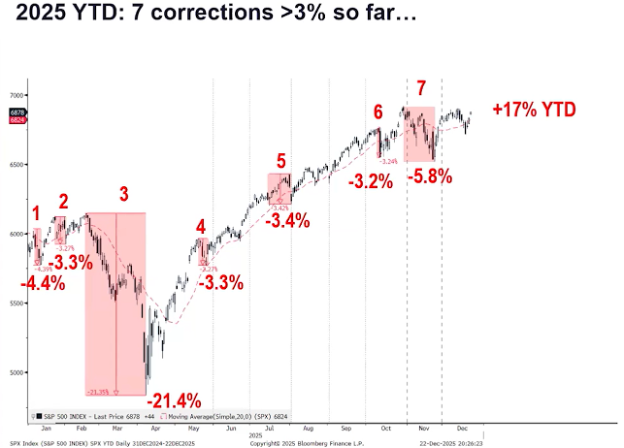
The last 22 times the Fed has lowered rates with the S&P 500 within 2% of record highs, stocks have been higher 12 months later 100% of the time. So, the fears that rate cuts lead to recession is only based on two data points (2008 and 2020) but both years were caused by exogenous one-off events which tanked the economy. Cycles in 1984, 1995, and 1998 eased policy without a subsequent recession as markets hit new highs. So here is where the heat has been in the US equity markets for 2025:
Markets made 7 new all-time highs this year. And as of Christmas, it is up 18%. Another great year. The moral of this story is, as can be seen in the chart below, where I have inputted the red boxes, sell-offs are really quite routine. It is just part of the normal vacillations of the markets. This year is actually ending on a better note than it did last year. Even though collectively 2024 performance was higher than 2025.
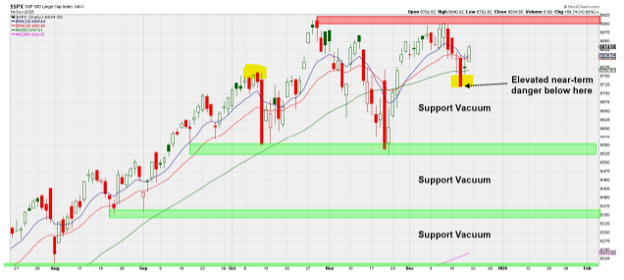
This looks really terrific, of course, assuming you are invested, but if we boil it down to just the last three months, things appear a bit more tenuous. As can be seen below, the pullback into last week took the S&P down to the same level it sat in October. This means that investors have suffered a very frustrating three months of back-and-forth action on the tail end of a very good year. Again, this is really sort of par for the course; a big move up, sideways digestion of the move, and then after more economic and earnings data the required input to tell the markets where to go next. Here is the picture that shows the back-and-forth:
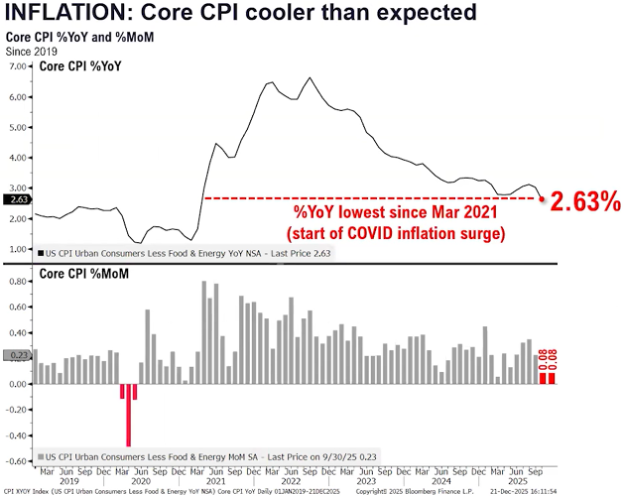
And while this tug-o-war has been going on, the Fed is easing and inflation is at very acceptable lows. This is huge fuel for the markets. Lower interest rates, without recession, and falling inflation is about the best recipe backdrop one can have. Here is the inflation picture:
Strangely enough, even though the economy, as measured by third quarter GDP at 4.3% in the face of lower inflation and better than expected earnings, Consumer Sentiment is the lowest it has been in history!
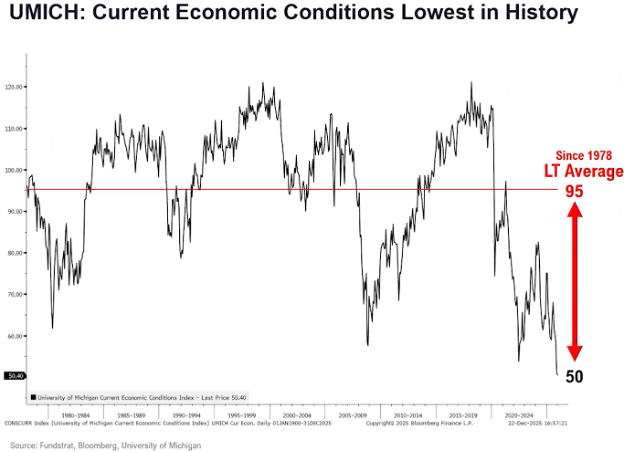
Without getting into a politicized debate. I believe the reason for this is that the overwhelming majority of respondents to these surveys are democrats, and I really don’t need to go into a discussion on the polarization that exists today between the current administration and the democratic minority.
Technically, where is the US equity market?
As this year slowly comes to a close, it’s important to take stock of the technical positives and negatives of the U.S. stock market, which has proven to be anything but easy, despite SPX having recorded gains of +17.64% year to date with four more trading days left in the year.
Positives heading into the End of the Year
Equity market technical trends remain in great shape, with an ongoing positive slope of higher highs and higher lows since 2020 and more recently 2022. The S&P looks to potentially finish 2025 near the highs of the year. See the chart above.
Intermediate-term momentum (based on MACD) is positively sloped and above the “signal line” on a weekly and monthly timeframe.
“Magnificent 7” has just broken out and looks poised to push back to new all-time highs into January.
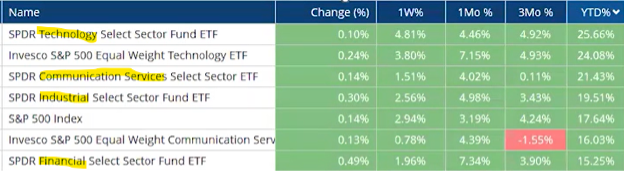
Some minor evidence of broad-based strength has begun to resurface, given that Financials, Industrials, Materials, and Discretionary all outperformed in the last month.
To the point above, market breadth has improved since late November and looks to be in better shape than it was this time in 2024 as the year comes to an end.
Small-caps and Mid-caps have begun to show better strength, heading into the end of the year.
Sentiment, albeit higher than a few months ago, is still not extraordinarily bullish, and is thought to be on the upper end of Neutral when considering both Institutional and Individual sentiment gauges.
Credit spreads remain tight and near record lows. This is something I will be going over in the New Year. What this means is that the difference in interest cost for speculative debt is not very much greater than non-speculative debt. This tends to signify that the markets do not fear economic problems on the horizon.
Technical negatives to pay attention to as 2025 comes to a close
Momentum has certainly grown overbought as 2025 has come to a close. This is a similar level to where consolidation started in 2018, and which coincided with market weakness in 2022.
Many monthly “Magnificent 7” names have begun to show evidence of waning momentum on a weekly basis. Others have grown quite overbought and will eventually require consolidation (likely in the 2nd Quarter 2026).
DeMark-based counter-trend indicators are within 2-3 months of lining up on a weekly, monthly, and quarterly basis, which might prove problematic in 2026, if/when they are confirmed. For now, these don’t look too troublesome, but I suspect that February/March might be an interesting time when many indicators on different timeframes begin to show a confluence of exhaustion.
Cycle composites for US stock indices clearly show consolidation as a best-case scenario and possible declines, which might prove to be 15-20% in 2026 before a recovery happens. This is based on Edward Dewey’s popular 41.3-month cycle for US stocks (roughly 3.5 years, or 180 weeks).
Market breadth remains lower on a 12-month gauge than this time last year, despite the short-term improvements. Furthermore, the percentage of Russell 3000 names (a far larger gauge than the S&P) within 20% of their 12-month highs is around 56%, which is somewhat troublesome, given that most US market gauges are near all-time highs. This remains lower than what was seen in 2024 during most of the year, along with 2021. Thus, U.S. equity indices are near all-time highs, but breadth is lower.
US Treasury yields are thought to turn back higher in 2026 (after their January-March decline) along with the yield curve steepening seen in many developed countries. This might prove problematic to US indices if the correlation to Stocks holds up.
I’ve really tried to pull most everything I could from my deep-dive work to get these indicators to you for your year-end mastication. Chew on them, ponder them, reflect on them, but remember the underlying fact that interest rates are falling without recession, and economy and corporate earnings are continuing to grow above trend. These should all point to higher equity prices in the future.
In closing, I wanted to reflect on the Year of the Snake (2025) and the Year of the Horse (2026). Spencer took the time to go over these two Chinese Zodiac studies.
The Year of the Snake (2025) is a season of turning inward. It asks you to slow down, listen closely, and shed what no longer fits—old habits, outdated beliefs, emotional weight you’ve quietly been carrying. Like a snake leaving behind its skin, this year is about quiet transformation: choosing peace over pressure, clarity over chaos, and learning to trust your inner wisdom. The changes may not always be loud or visible, but they are deep, intentional, and necessary. This is the year you clear space.
Then comes the Year of the Horse (beginning February 17, 2026)—and everything begins to move. The Horse arrives with momentum, confidence, and fire in its stride. After the introspection and refinement of the Snake, this year encourages you to act on what you’ve learned. It’s about freedom, passion, courage, and saying yes to opportunities you’re finally ready for. Where the Snake whispers, the Horse charges forward—heart open, head high, and eyes on the horizon.
Year of the Snake (2025)
- Energy: Introspective, intuitive, wise, subtly powerful, transformative
- Theme: Shedding old layers, releasing what no longer serves you, finding inner peace, clearing out old patterns
- Action: Gentle but intentional shifts, conscious choices, preparing emotionally and mentally for what’s next
Year of the Horse (2026)
- Energy: Bold, fast-paced, passionate, free-spirited, courageous
- Theme: Forward motion, clarity, growth, risk-taking, embracing opportunity, progress
- Action: Taking decisive steps, breaking through stagnation, welcoming breakthroughs and momentum

The Transition
The shift from Snake to Horse is a transition from stillness to action, from shedding to moving forward with purpose.
The Snake does the quiet, sometimes uncomfortable work of release; the Horse rewards that courage with freedom and forward motion.
In essence, the Snake prepares you—and the Horse sets you free, carrying you forward with clarity, confidence, and the courage to finally run toward what you want. Cheers to a prosperous and healthy 2026.
- Ken South, Tower 68 Financial Advisors, Newport Beach
-
Get Ken's Weekly Market Commentary Delivered To Your Inbox!
Important Disclosures:
The opinions voiced in this material are for general information only and are not intended to provide specific advice or recommendations for any individual. To determine which investment(s) may be appropriate for you, consult your financial professional prior to investing. All performance referenced is historical and is no guarantee of future results. All indices are unmanaged and cannot be invested into directly.
All information is believed to be from reliable sources; however LPL Financial makes no representation as to its completeness or accuracy.
Investing involves risks including possible loss of principal.
The Standard & Poor's 500 Index is a capitalization weighted index of 500 stocks designed to measure performance of the broad domestic economy through changes in the aggregate market value of 500 stocks representing all major industries. The S&P 500 is a stock market index tracking the stock performance of 500 of the largest companies listed on stock exchanges in the United States. Indexes are unmanaged and cannot be invested in directly.
The Dow Jones Industrial Average is comprised of 30 stocks that are major factors in their industries and widely held by individuals and institutional investors.
The Nasdaq-100 is a large-cap growth index. It includes 100 of the largest domestic and international non-financial companies listed on the Nasdaq Stock Market based on market capitalization.
The Russell 2000 Index is an unmanaged index generally representative of the 2,000 smallest companies in the Russell 3000 index, which represents approximately 10% of the total market capitalization of the Russell 3000 Index.
Data sourced from Bloomberg (2025).
Stock investing includes risks, including fluctuating prices and loss of principal.
Bonds are subject to market and interest rate risk if sold prior to maturity. Bond values will decline as interest rates rise. Bonds are subject to availability, change in price, call features and credit risk.
Government bonds are guaranteed by the US government as to the timely payment of principal and interest and, if held to maturity, offer a fixed rate of return and fixed principal value.
Bond yields are subject to change. Certain call or special redemption features may exist which could impact yield.
International investing involves special risks such as currency fluctuation and political instability and may not be suitable for all investors.
Alternative investments may not be suitable for all investors and should be considered as an investment for the risk capital portion of the investor’s portfolio. The strategies employed in the management of alternative investments may accelerate the velocity of potential losses.
This information is not intended to be a substitute for specific individualized tax advice. We suggest that you discuss your specific tax issues with a qualified tax advisor.
The economic forecasts set forth in this material may not develop as predicted and there can be no guarantee that strategies promoted will be successful.
LPL Tracking #842291
Image Citations:
- Bloomberg News. (2025, November 11). SPX Quote – S&P 500 Index [Chart]. Bloomberg. Retrieved from https://www.bloomberg.com/quote/SPX:IND
- SPX Index (S&P 500 Index) SPX YTD Daily 31DEC2024-22DEC2025 Copyright 2025 Bloomberg Finance L.P.
- StockCharts.com. (2025, December). S&P 500 Large Cap Index (SPX) Technical Chart with Support Zones. Retrieved from https://www.stockcharts.com
- Anstey, C. (2025, December 18). Here Are the Key Takeaways From the US CPI Report for November [Graph]. Bloomberg. Retrieved from https://www.bloomberg.com/news/articles/2025-12-18/us-cpi-report-november-2025-key-takeaways-on-inflation-core-measure
- Bloomberg Finance L.P., Fundstrat, & University of Michigan. (2025, December 22). University of Michigan Current Economic Conditions Index – Historical Chart. Bloomberg Terminal. Retrieved from Bloomberg Professional Services.