


We have just completed a few major things this past week:
- Q2 earnings releases and forecasts for into year end.
- Trump is working diligently to stop the global conflicts and do all in his power to create a more level playing field of trade.
- The normally negative period of August to September is in full swing and should provide a pause to refresh. We don’t really know if this will simply be a sideways action or a pullback but given that future earnings projections have been quite consistently positive, I wouldn’t suspect a major decline.
- The catalyst for the year-end push could be the interest rate cuts that are expected at the September Fed meeting. This meeting will be September 16 & 17 and could be a perfect time to dovetail with the end of the summer softness.
Given these points, I thought I would go into a bit of depth on each so that you could truly understand what I feel could be the cards that we are currently holding and what our probabilities are for a good (or bad) hand going into year end.
Second Quarter Earnings
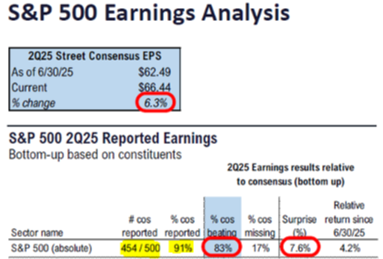
- Of the 454 companies that have reported so far (91% of the S&P 500):
- Overall, 83% are beating estimates, and those that “beat” are beating by a median of 6%.
- Of the 17% missing, those are missing by a median of -3%.
- On the top line, overall results are beating estimates by a median of 5% and missing by a median of -5%, and 79% of those reporting are beating estimates.
When evaluating earnings reports, it must be remembered that the reports are what “has happened.” This is opposed to “what is expected to happen.” This is the reason why it is very difficult to know exactly what to expect going forward. There are so many variables that are important in handicapping forward expectations, and every company and every time these different variables are of differing importance. Since overall prices continued to advance, and advanced after very strong periods of over two years, this tends to infer that forward earnings are still expected to remain robust.
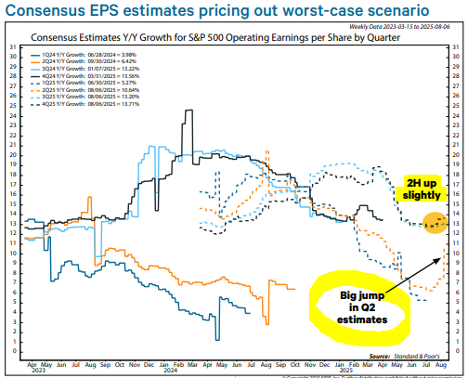
The Q1 earnings season was filled with uncertainty (clearly due to the tariff unknowns). Some companies lowered guidance. Others provided earnings scenarios. Dozens of S&P 500 companies pulled earnings guidance altogether. Analysts responded by lowering not only Q2 estimates but also Q3 and Q4 numbers. With the worst-case scenario not coming to fruition, companies have exceeded low expectations. Year/year single quarter S&P 500 operating EPS growth consensus estimates have jumped from 6.7% on June 30 to 10.6%. At a time when analysts typically lower second half numbers, Q3 and Q4 consensus estimates have risen.
Trump’s peace talks
Last Friday was a rather momentous meeting in Alaska between Putin and Trump in Alaska. It was sure to be full of many different points to be discussed, but the fact that they are sitting down to begin to figure out a way to create peace in the region is truly most important. There is not a bunch to be said other than the points that have been made public by the media, but the true outcome I believe is being reflected in the price of defense sector stocks, oil, gold and the US Dollar.
It was logical that with a ton of conflict going on that defense stocks would be strong as the expectation is for more purchasing of drones, missiles, aircraft, and other defense tools would be ramped up. Since oil is the primary export and backbone of the Russian economy, Putin really needs to negotiate a treaty that provides him the ability to sustain his economy with robust petroleum exports. As such, the price of oil should decline as it is. As conflicts subside, the flight to safety in the global medium of exchange- gold should mellow out a bit and therefore the price of gold should stabilize and maybe decline. This seems to be happening. And lastly, the global currency should be stable as it stops being heavily politically charged.
August to September negative period, “Is Doomsday Here?”
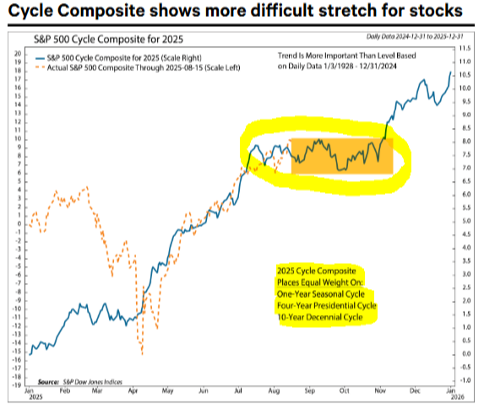
Starting with our 2025 outlook, based on the Presidential Cycle, we have been warning of the tendency for the second half of post-election years to be choppy for stocks. The future has become the present, with the S&P 500 peaking in early August, on average (chart, above). Seasonal tendencies are just that – tendencies. They hold true most cycles, but they can be overwhelmed by outsized forces, such as a pandemic or financial crisis. The question feels especially relevant for 2025, given financial markets have been so news driven. The chart illustrates both pros and cons of paying attention to the presidential cycle. The case against is that volatility was so much greater than normal from late March through May. The case for is labeled on all our cycle charts: trend is more important than level. When averaging dozens of years, volatility is dampened. The cycle's suggestion for a choppy start to 2025, February – April weakness, and April – July rally have generally held true. Now, as I have been espousing in the most recent weekly comments, things could get a little tough for a bit.
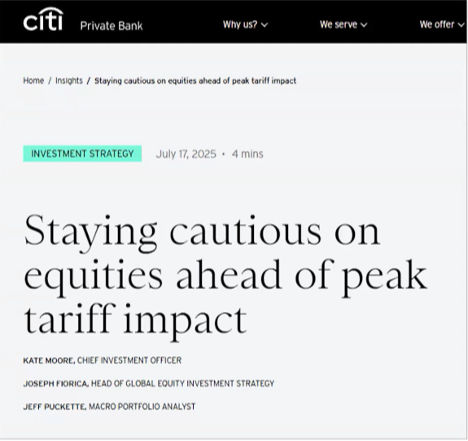
Along with the Presidential Cycle historical, these are some things that we are seeing out of the press in regard to major research department commentaries. In Mid-July this is what Citibank said to its private banking clients:
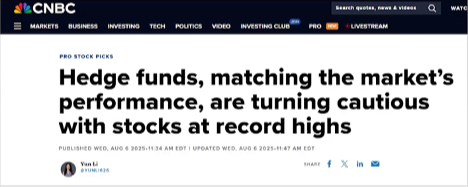
Then in the beginning of this month, this was the comment out of CNBS:
September 16 & 17 Fed meeting and potential interest rate cuts:
After a poor jobs report-induced pullback into August 1, the S&P 500 and Nasdaq have recovered to record highs. The rally has broadened in the last week to include previous laggards like small-caps. This addresses the “breadth” issue as laggard parts of the market have joined the party. The move has come as the market enters its toughest seasonal period. As discussed last week, what appears to be technical factors on the surface are often driven by fundamentals. The corollary is that fundamentals can disrupt seasonal trends. Two big factors have done just that. First, the July CPI report opened the door further for the Fed to cut interest rates in September. Second, the Q2 earnings season is one of the best in years. While the news is positive not only for the near term but also for the longevity of the cyclical bull market, it does not mean the seasonally weak period that runs through October can be ignored. The minor breadth divergences that developed in July have not completely cleared, and sentiment is on the verge of morphing from frothy to downright optimistic. The stock market’s main takeaway was that there was not enough evidence to conclude tariffs are leading to an inflation spiral.
Combined with the weak July jobs report, the latest inflation data from last week suggest there is room for the Fed to lower its benchmark interest rate at its September 16-17 FOMC meeting. It would be the first cut since December 18, 2024. As I have been saying, the S&P 500 has tended to rally in the months before and after it resumes an easing cycle after pausing for six months or more (chart, below). The rationale is that the Fed likely paused over a combination of inflation concerns and confidence the economy did not need additional stimulus. The resumption often means inflation fears have been addressed.
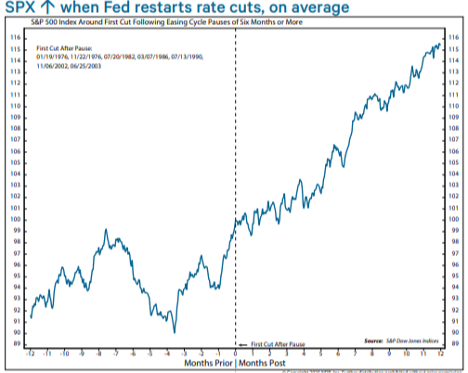
Take a closer look at the chart above. Note that going into a rate cut the market is quite indecisive. This fits perfectly with the August – September negative calendar period. But when the rate cut hits, all negative bets are off and if history is a guide, this could prove to be a very good last quarter of the year.
I believe it is important to pay attention to “the why” Seasonal trends do not occur in a vacuum. The question for the remainder or 2025 is if the factors that often drive subpar equity returns are in place. As I have discussed in previous notes, those forces are in play, but the outcome is TBD. According to the media, the answer lies in the buzzword of the year: tariffs. Before diving into the details, we want to emphasize that our recommendations are driven by our models, which are based on a variety of indicators. We focus on current cyclical moves but also look for very strong correlating calendar types of issues. What is hugely important to remember is that there are many tools on the analytical toolbox, but each tool is useful or not useful at all at different points in time. For this reason, nothing can be completely relied upon. The action of the markets; currency, bond and equity, must always be evaluated for continuations of current moves or changes which could infer that something new is afoot.
According to Jeffrey Saut of Saut Strategy, “the markets do not care about the absolutes of ‘good’ or ‘bad’ but whether things are getting ‘better’ or ‘worse’.” The stock market, at least, was priced for the worst-case scenario after Liberation Day and the crash that coincided with it. As we’ve walked back from the edge of the economic abyss and trade deals have been made, investors have felt better and better about adding back. The economics of the companies as illustrated by first and second quarter earnings reports have validated that the tariff issues were mostly immeasurable and therefore difficult to quantify so many investors ran to the sidelines. The problem with the strategy is one must exercise perfect timing on the exit and then again perfect timing on the reentry.
There has been no break of notable support since April. So, the exit could have been a bit clearer as President Trump told the world exactly what he was going to do. But the market only listened for a brief time. I don't think it's fair to say that the technical analysis has stopped working over the past few months, but this type of analysis clearly does not agree with the fundamentals. Markets don’t ever move in a straight line but instead sort of ebb and flow. Since the aggressive April ebb, there has been a lot of flow without a measurable ebb to give the money on the sidelines a chance to reenter. With the 6200 level, in particular, surviving two direct attempts to break down beneath it. The green lines below are what I would consider obvious horizonal support, and there has not been a single violation of one of these lines during the rally. And, of course, 6200 remains the key short-term level to watch and it will need to break before we can have any chance of seeing a more meaningful pullback. Here is a very clear picture of what I am referring to:
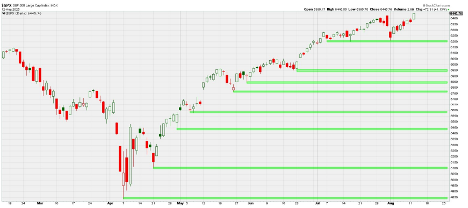
It was surprising to see all that potential resistance sitting overhead of the market after April be completely ignored. Nevertheless, even that gave us information we could use. It was evidence of the market's strength in and of itself. That one-sided buying thrust helped make me feel comfortable taking more chances despite or perhaps because of the fact that the market didn't do what I thought it most likely to do if the tariffs ended up being the media “Trumped” them up to be. Much of the frustration stems from the kind of action we've witnessed over the past couple of weeks. The reversal that took place a couple of weeks ago (the poor labor numbers a few Fridays ago) was "supposed" to result in even more downside, and the beginning of the August- September pullback that can be seen on the first picture above. It was practically a textbook bear signal. Rather than continuing lower or bouncing a bit before rolling back over, however, we have witnessed yet another V-shaped recovery in the S&P 500.
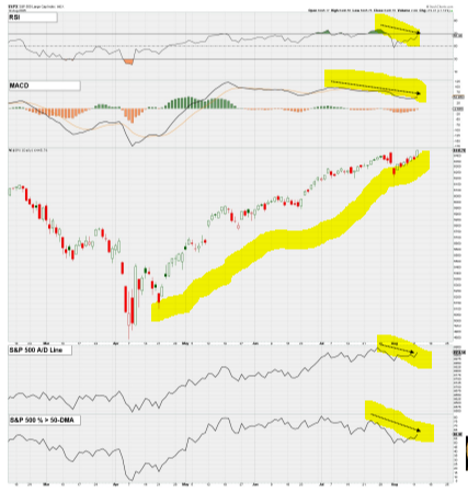
The next issue is the one I have spoken about for the last two weeks, “breadth.” More and more breadth and momentum indicators are not making higher highs along with the indices. That is supposed to be a warning sign since such action often happens near the end of rallies. To repeat for what feels like the hundredth time, though, it is only a warning and not an outright sell signal until we actually see downside follow-through sufficient to break under some form of support. Without that, the melt-up will continue to follow the line of least resistance. Last week I had a picture that reflected the divergences caused by an expansion of breadth.
I still believe we must watch for warning signs even though it has mostly been a waste of time recently. Prior to the last dip in the market, there were signs that the internal market was weakening even as the S&P 500 kept making higher highs. Fewer stocks were participating, and momentum had slowed some. That did not result in much downside in the index itself, though since then the market has continued to narrow and soften. For instance, the S&P 500 made yet another new all-time high on Tuesday of last week, but some indicators did not "confirm" that high by making higher highs of their own (thereby creating a "negative divergence"). What's more, other indicators such as the S&P 500's Advance-Decline line and the percentage of S&P 500 stocks above the 50-day moving average also did not make higher highs on the day. For now, it is a red flag, but without subsequent downside follow through it is only a warning rather than an outright sell signal. Prices can still go higher, even enough to erase some of these divergences, though these non-confirmations do make me less interested in chasing the market higher.
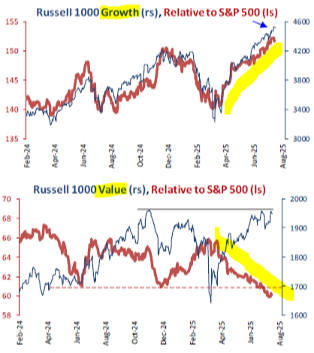
In closing, the most graphic illustration of what has been driving the positives in the markets and the negatives are the differences between the growth side and the value side of the US equity market. You can see below the pictures of the growth side relative to the entire S&P 500 and then the value side relative to the same index. It is incredibly obvious where the performance has come from.
This is not to say that it will necessarily continue in a straight line but that this is still where an overconcentration should remain, until this relationship changes. Unfortunately, there is nobody that rings a bell and says to change, but please know that we will be paying close attention and will be sure to alert you if we feel there is significant changes that should be made.
- Ken South, Tower 68 Financial Advisors, Newport Beach
-
Get Ken's Weekly Market Commentary Delivered To Your Inbox!
Important Disclosures:
The opinions voiced in this material are for general information only and are not intended to provide specific advice or recommendations for any individual. To determine which investment(s) may be appropriate for you, consult your financial professional prior to investing. All performance referenced is historical and is no guarantee of future results. All indices are unmanaged and cannot be invested into directly.
All information is believed to be from reliable sources; however LPL Financial makes no representation as to its completeness or accuracy.
Investing involves risks including possible loss of principal.
The Standard & Poor's 500 Index is a capitalization weighted index of 500 stocks designed to measure performance of the broad domestic economy through changes in the aggregate market value of 500 stocks representing all major industries. The S&P 500 is a stock market index tracking the stock performance of 500 of the largest companies listed on stock exchanges in the United States. Indexes are unmanaged and cannot be invested in directly.
The Dow Jones Industrial Average is comprised of 30 stocks that are major factors in their industries and widely held by individuals and institutional investors.
The Nasdaq-100 is a large-cap growth index. It includes 100 of the largest domestic and international non-financial companies listed on the Nasdaq Stock Market based on market capitalization.
The Russell 2000 Index is an unmanaged index generally representative of the 2,000 smallest companies in the Russell 3000 index, which represents approximately 10% of the total market capitalization of the Russell 3000 Index.
Data sourced from Bloomberg (2025).
Stock investing includes risks, including fluctuating prices and loss of principal.
Bonds are subject to market and interest rate risk if sold prior to maturity. Bond values will decline as interest rates rise. Bonds are subject to availability, change in price, call features and credit risk.
Government bonds are guaranteed by the US government as to the timely payment of principal and interest and, if held to maturity, offer a fixed rate of return and fixed principal value.
Bond yields are subject to change. Certain call or special redemption features may exist which could impact yield.
International investing involves special risks such as currency fluctuation and political instability and may not be suitable for all investors.
Alternative investments may not be suitable for all investors and should be considered as an investment for the risk capital portion of the investor’s portfolio. The strategies employed in the management of alternative investments may accelerate the velocity of potential losses.
This information is not intended to be a substitute for specific individualized tax advice. We suggest that you discuss your specific tax issues with a qualified tax advisor.
LPL Tracking #785624