


“How is the market still going up?” At this point I am asked some version of the same question every day: how is the stock market still going up? Many such questions are rhetorical and asked with underlying joy due to market participation and continued increases in account values, but at the same time due to the endless barrage of negative media commentary the need to wonder in the back on one’s mind when the music is going to end. Markets don't have to make sense and attempting to assign reasons to their behavior is often an exercise in futility at best and a complete waste of time at worst. I don't think we can truly ever "solve" the market with any high degree of confidence, at least not without the benefit of perfect hindsight. Instead, we can only make observations, compare them to what has come before, and then make smart, probabilistic risk vs reward decisions based on those comparisons.
Regardless of what is making it happen; the bottom line is that the market is not being given sufficient cause to sell or even to stop buying. Yes, valuations are at historical extremes, the economy is softening, and it feels somehow "wrong" for the market to just go up with no meaningful pullback. However, until either some black swan-ish event occurs or enough of those above positive forces are removed from the board, the market appears content to ignore any and all headwinds. Once stock prices do eventually reverse, whether that be tomorrow or a year from now, it will appear obvious in hindsight that such a reversal should have occurred. In the meantime, the trend can certainly continue, which is why I keep reiterating that we need to see evidence that the status quo is changing before we can have any real conviction for a different outcome.
As of now, the market is giving no sign that we are there yet even if the internal action has not been as strong as the major indices suggest. The S&P 500 has been positive 16 out of 24 sessions since the start of September. I focus on this as I have been saying that September has a tendency to be the worst month of the year, and this clearly was not what we just experienced. Void of a Black Swan event of some type, what makes the market especially vulnerable to a long-term decline is the potential for reallocation if investors start to realize that buying a dip is no longer the winning strategy that it has been since the secular bottom of 2009. While respecting the global market uptrend our concerns have included the high complacency reflected by sentiment indicators, the lack of confirmation evident in our breadth indicators, and the negative cyclical influences indicated by the August and September tendencies of the one-year and four-year cycles I often quote.
The global bull market has exceeded its normal cyclical bull duration as well as the norm for cyclical within secular bulls. To refresh memory, cyclical is the short-term, secular is that long-term. For example, the markets bottomed after the Great Financial Crisis and have been going up ever since (secular move), yet there have been periods of negative return within this longer-term move (cyclical digestions / corrections).
One of the biggest thorn’s in the side of the argument for the market’s need to drop is the boom in AI and whether it really does have the teeth that the market seems to be showing. Here are the latest comments on AI that I feel are most telling. I take these from Bloomberg research commentary:
- Business Adoption of AI Will Take Years, Say Venture Capitalists and Executives - Experts at The Information's AI Agenda Live conference suggest AI adoption by businesses will take years due to the need for worker training and system integration, while highlighting concerns over AI chip memory limitations impacting user access and inference workloads; conversely, they noted rapid advancements in AI coding capabilities, with some predicting superhuman performance in specific coding tasks within the next few years, though skepticism remains. AI adoption in businesses will be a multi-year process requiring worker training and integration into existing systems. AI chips face a memory capacity crisis that limits the number of users that can use the AI service. AI models have demonstrated remarkable improvements in coding, particularly in generating code blocks, but struggle with piecing code together across multiple files. Startups can compete with tech giants by specializing in specific verticals and becoming indispensable to their users. Consumer robots offer a promising avenue for AI learning due to the diversity of human behavior they can observe in home environments.
- AI is not killing jobs, finds new US study - Research from Yale University Budget Lab and the Brookings Institution indicates that the mass adoption of ChatGPT has not yet had a significant disruptive impact on the US job market, contradicting claims of widespread job losses due to AI, with economists finding little evidence that AI is putting people out of work or drastically altering the composition of jobs. Despite concerns, generative AI has not caused a dramatic effect on overall US employment. There's limited evidence that AI is putting people out of work, according to labor market data analysis. Claims by chief executives and tech bosses about AI's rapid reshaping of the labor market may be overblown. The difficulties faced by recent college graduates in finding work appear unrelated to the rise of generative AI. AI adoption's impact on the workforce may be "transitory," as suggested by Goldman Sachs Research. AI companies are incentivized to drum up attention for their technologies to encourage companies to build the computing capacity they need to create bigger AI models. Continuous monitoring of AI's effect on the labor market is crucial.
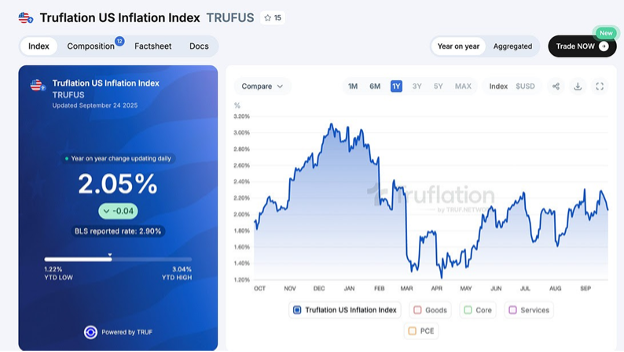
At the end of the day, all of the nasty things: tariffs, immigration, AI, employment, etc. are all reflected in the inflation numbers. From the inflation numbers interest rate policy, it determined and based on cost of funds due to interest rates and inflation, growth is then either enhanced or stifled. So, the Fed and Truflation are telling you tariffs didn’t bring inflation. But many don't believe it because the cost of essentials from food to energy to housing to education to healthcare continue to climb albeit at a slower pace. The discrepancy is partly due to deflationary AI and the tariffs which at least are not inflationary so far. It could also be due to doctored data which skew the results in favor of lower inflation. Either way, markets vote with their capital based on the numbers, whether doctored or not, thus the march to new highs for leading stocks and major averages.
Further, GDP is surging higher as the impact of AI is felt. Companies are growing faster and doing more with less employees. Efficiency is taking over the market. The government is capturing hundreds of billions of dollars in newfound tariff revenue. Interest rate reductions are another tailwind. In the words of William O'Neil, never argue with the market. At the beginning of September there was a fascinating interview with Liz Everett, head of Bank of America’s Institute, which analyzes BofA’s proprietary data to track real-time economic trends, US consumers are saving, spending, and paying off credit-card debt, all at a pace exceeding the prepandemic era.
Higher income consumers, who drive more than half of US spending, are especially well off and eager to spend, due in part to outsize wage and stock market gains in recent years. Since 70% of GDP is based on consumption, this is super important. What the institute revealed that was truly shocking, was that both middle and lower-income households have grown their check and savings deposits by more than 50% since 2019, on a nominal basis.
The government shutdown started on Wed 12:01am ET and this means that we will not be getting data from BLS or any agency until the shutdown is over. But we think this is a “sidebar” issue and probabilities heavily favor stocks strong from Oct to Dec this year — in fact, according to Thomas Lee of FundStrat, he see S&P 500 reaching at least 7,000 by year-end and maybe higher.
- The government shutdown lasted 35 days in Dec 2018 and this would be a long stretch. In fact, it would be so long, the Fed would not have any new data for its Oct FOMC rate decision (10/29) and most likely would have to rely on the August jobs report (weak) and then ADP last week. This would be dovish, because the Fed would have to act with caution.
- After all, the economy suffers from a shutdown, from lost activity, so this would be a reason for the Fed to lean dovish on its next rate decision. The ADP report was soft and what was notable, in our view. It fell month over month and the yoy pace is settling in at 6.6%, so this hardly paints a picture of a strong jobs market.
- I would not lean “bearish” because of shutdowns. Shutdowns have rarely created lasting impacts on equities, as I explained in Friday’s special report. So, if stocks are down, we would be dip buyers. This is something to be mindful of, as we may hear of dire warnings of calamity because of the shutdown.
- But more importantly, we are entering the strong seasonal period (4Q) and this means stocks higher.
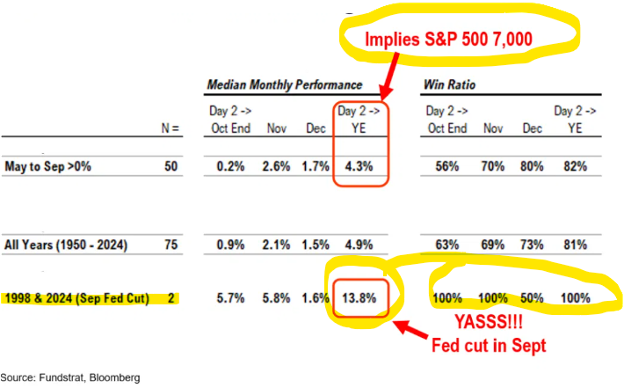
- since 1950, Oct to Dec median gain +4.9%
- this implies S&P 500 7,050
- win-ratio 81%
- Fed cut in Sep, like 1998 and 2024
- avg gain 1998/2024 +13.8%
- implies S&P 500 7,750
- You get the picture. There is a strong seasonal tailwind underway, and the upside is higher given the Fed is dovish. That is what we think also makes sense, given the continued skepticism around equities.
Below is the graphic from Fundstrat that shows, if May to September the markets are positive, they are positive, on average, 4.3% 82% of the time. If we are to look at this period when there are rate cuts and the market was positive, the last part of the year the market was up 13.8% and up 100% of the time. Wow!
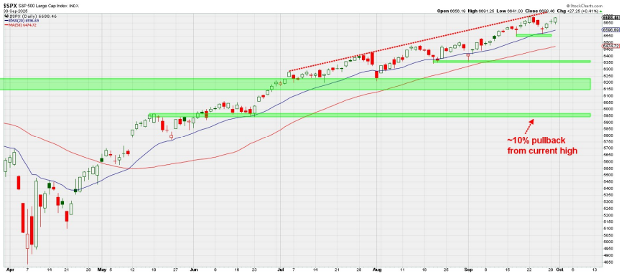
S&P 500 Ends September Unscathed
The S&P 500 got through the "scary" month of September with its up-trend well intact. Dips continue to be minor and have been contained above notable prior lows throughout this rally. With no real support falling, it isn't providing much reason at all for most to sell. As mentioned, that will remain the case as long as the index remains above the recent “double bottom” lows around 6550. A break of that support would be cause to be more defensive, though even returning back down toward 6000 seems speculative given how minimal downside has been lately.
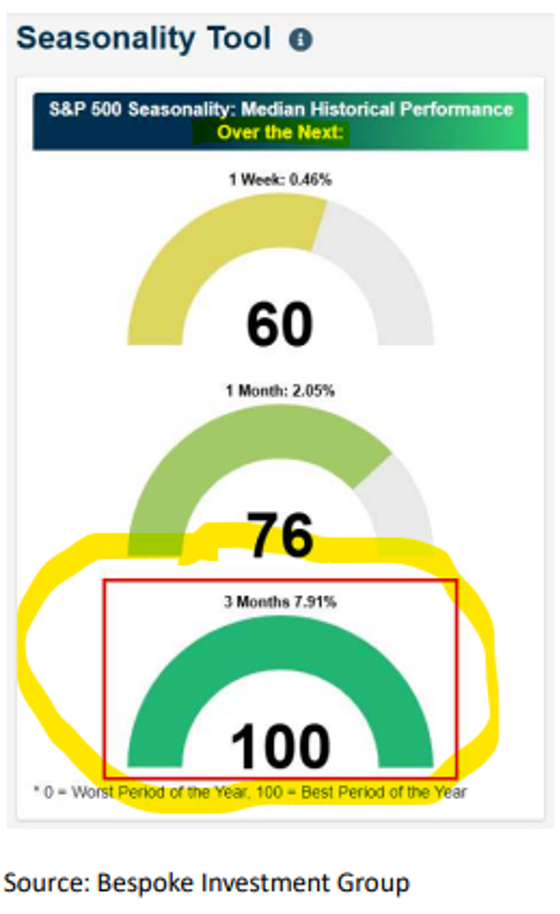
Now Entering Best 3 Months of the Year, Especially in Bullish Years
Coming into the month, a lot was made of the fact that September has historically been the worst month of the year for stocks. The market has been down 55% of the time in September since 1928, but that also means it has been "up" 45% of the time. 2025 was one such time. That now means we have entered what has historically been the "best" 3-month period of the year starting this past Monday according to Bespoke Investment Group. What's more, the returns tend to be augmented even more during "up" years. As we saw with September's action, historical tendencies are only a general guide rather than a set in stone guarantee, but it is yet another feather in the cap of the bulls.
Wall of worry
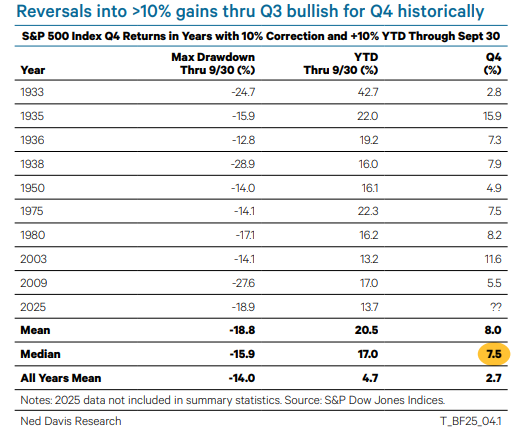
Tariffs, profit margins, valuations, the labor market, and Fed independence were some of the many reasons for investors to be concerned in Q3. Despite those fears – or from a contrarian point of view because they existed and largely did not come to fruition – the stock market posted one of its best returns in years. The S&P 500 gained 7.8% in Q3, its best third quarter since 2020. Despite September being the worst month of the year historically, the benchmark rallied 3.3% last month, the best September since 2010. The table below puts the year-to-date gyrations into perspective. This is only the 10th time since 1929 that the S&P 500 has endured a 10% correction and is up at least 10% through Q3. The previous nine times, the S&P 500 rose every time in Q4 by a median or 7.5% versus an average of 2.7% for all fourth quarters. The message is that reversals have carried positive momentum through year-end.
Overvalued markets?
Many are complaining that the market of today is totally overvalued and hence in a “bubble” type of situation. Today's market is not the dot-com market of the 90s, not just because companies hold a lot more actual value, but also because their balance sheets carry less leverage, much like the consumer as evidenced by the Bank of America study referenced earlier in this note. Most debt is long-term and fixed, and over 60% of the S&P 500 is rated “high quality” compared to less than 50% two decades ago.
Today's multiples are the new normal. Further, dating back to 1928, the S&P 500 has notched a positive fourth quarter, 74% of the time, averaging a 2.9% gain. The Nasdaq 100 performs even better, up more than 6% on average. We also have the tailwind of rate cuts. The Fed cutting against a backdrop of broadening and accelerating profits spurs EPS and GDP growth. Companies are becoming more valuable, rather than stock appreciation due to some market mania that is unsustainable.
- Ken South, Tower 68 Financial Advisors, Newport Beach
-
Get Ken's Weekly Market Commentary Delivered To Your Inbox!
Important Disclosures:
The opinions voiced in this material are for general information only and are not intended to provide specific advice or recommendations for any individual. To determine which investment(s) may be appropriate for you, consult your financial professional prior to investing. All performance referenced is historical and is no guarantee of future results. All indices are unmanaged and cannot be invested into directly.
All information is believed to be from reliable sources; however LPL Financial makes no representation as to its completeness or accuracy.
Investing involves risks including possible loss of principal.
The Standard & Poor's 500 Index is a capitalization weighted index of 500 stocks designed to measure performance of the broad domestic economy through changes in the aggregate market value of 500 stocks representing all major industries. The S&P 500 is a stock market index tracking the stock performance of 500 of the largest companies listed on stock exchanges in the United States. Indexes are unmanaged and cannot be invested in directly.
The Dow Jones Industrial Average is comprised of 30 stocks that are major factors in their industries and widely held by individuals and institutional investors.
The Nasdaq-100 is a large-cap growth index. It includes 100 of the largest domestic and international non-financial companies listed on the Nasdaq Stock Market based on market capitalization.
The Russell 2000 Index is an unmanaged index generally representative of the 2,000 smallest companies in the Russell 3000 index, which represents approximately 10% of the total market capitalization of the Russell 3000 Index.
Data sourced from Bloomberg (2025).
Stock investing includes risks, including fluctuating prices and loss of principal.
Bonds are subject to market and interest rate risk if sold prior to maturity. Bond values will decline as interest rates rise. Bonds are subject to availability, change in price, call features and credit risk.
Government bonds are guaranteed by the US government as to the timely payment of principal and interest and, if held to maturity, offer a fixed rate of return and fixed principal value.
Bond yields are subject to change. Certain call or special redemption features may exist which could impact yield.
International investing involves special risks such as currency fluctuation and political instability and may not be suitable for all investors.
Alternative investments may not be suitable for all investors and should be considered as an investment for the risk capital portion of the investor’s portfolio. The strategies employed in the management of alternative investments may accelerate the velocity of potential losses.
This information is not intended to be a substitute for specific individualized tax advice. We suggest that you discuss your specific tax issues with a qualified tax advisor.
LPL Tracking #807316