


We have been bullish on U.S. stocks all year. Of course, this is contrary to the belief of many coming into the year. After the steepest rate hike cycle ever seen, many analysts simply felt that all the oxygen had been sucked out of the room. These same analysts were doubting a soft landing and instead fearing that a recession was in the cards. They felt that the only hope would be for a rate cutting cycle to unfold, and on this they were also wrong. Instead, going into the second half, the positive cyclical story remains intact. The modest earnings acceleration is continuing, the economy and inflation appear to be moderating enough for the Federal Reserve to lower its benchmark rate (although as time goes on even this is seeming less and less likely), and the market tends to enjoy a year-end rally during presidential election years. Given the broad influence of:
- Massive capital still available for both companies and investors from the $6 Trillion still sitting on the sidelines.
- Economic indicators beginning to show slowdowns, such as used & new car sales plummeting, several industrial and steel companies guiding lower in recent weeks, global slowdowns in China.
- Continued, although not highly publicized, additional Quantitative Easing being released on our domestic economy by the Biden administration to prop up the economy for their voting benefits going into the election.
The outlook is not without potential pitfalls. With a 15.0% year-to-date gain, the S&P 500 is on pace for the second-best first half of an election year on record, after 1976. The rally has left valuations stretched, sentiment optimistic, and the market overbought. Breadth has narrowed even as benchmarks like the S&P 500 and Nasdaq Composite have continued to make all-time highs. High valuations and narrowing leadership leave the market vulnerable for bigger drawdowns should the bullish fundamental/macro backdrop falter. This last week and this week have demonstrated what the Nasdaq and the S&P 500 do when these leaders suffer from profit taking. What hasn't been discussed is the fact that this week marks the end of the second quarter and the first half of the year. When a calendar cutoff like this is coming, many institutions and pension funds need to decrease over concentrations and balance portfolios. When a concentration in the large technology companies have grown to outsized levels, they have to sell them down for their reporting. Oftentimes, these same institutions will jump right back into these as they are continuing to exhibit exemplary earnings growth.
Three of the most important considerations for the second half of the year that that I am focusing on are:
- Stronger corporate investment can help US growth beat expectations yet again.
- Higher profit margins for S&P 500 companies could be the new normal. These are buoyed by the massive cash hoard that still is in the hands of the consumer.
- Geopolitical challenges may drive market volatility more than monetary policy. These challenges aren't just from overseas. Our own Presidential election is sure to be fraught with fireworks beginning in this Thursday's debate.
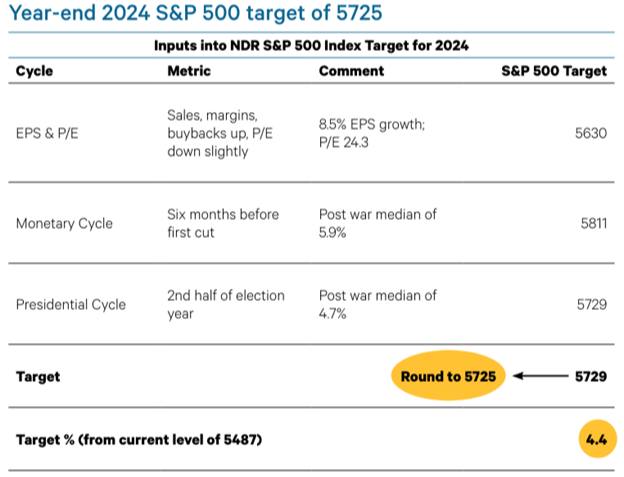
Our conclusion is to maintain an overweight position in equities for now, but prepare for more defensive positioning, potentially in the third quarter. Whether, when, by how much, and for how long will be dictated by our models. Our base case is that any pullbacks would be seasonal in nature and not the start of a cyclical bear market. Long-time clients know that our approach is to follow our models and indicators. I often say in the face of all the media negativity, "What is it that the markets know that the analysts don't? The money seldom lies." Hence, our bullish outlook so far in 2024. We find the thought process of creating directional price targets for the S&P 500 helpful but for the most part meaningless as these same targets are either lowered should some black-swan event hit the markets, or raised should the indexes rise above them. One of the research platforms I follow closely is Ned Davis Research (NDR). They recently reanalyzed the three factors used in their 2024 outlook and have raised their year-end S&P 500 target to 5725.
Earnings growth
For the first input, Ned Davis Research is increasing their S&P 500 operating EPS estimate from 6.5% to 8.5%. Several factors contribute to the upward revision. First, the real GDP forecast has been raised from 1.0- 1.5% to 1.5-2.0% and the inflation forecast from 2.5-3.0% to 2.75-3.25%. As a result, sales estimates have risen from 4.5% to 5.25%. Profit margins have risen from their level in November 2023, so they bumped them up 25 basis points. Finally, several mega-caps have announced major stock buyback plans. At the same time, even though prices of the S&P 500 have had a nice advance, the Price / Earnings ratio has maintained a modest 0.1-point decline, consistent with the second year of bull markets following non-recession bear markets. This is important. If one considers the markets overvalued, it is to be recognized that the P/E ratio of the index has actually declined as earnings have grown even faster than prices!
December rate cut
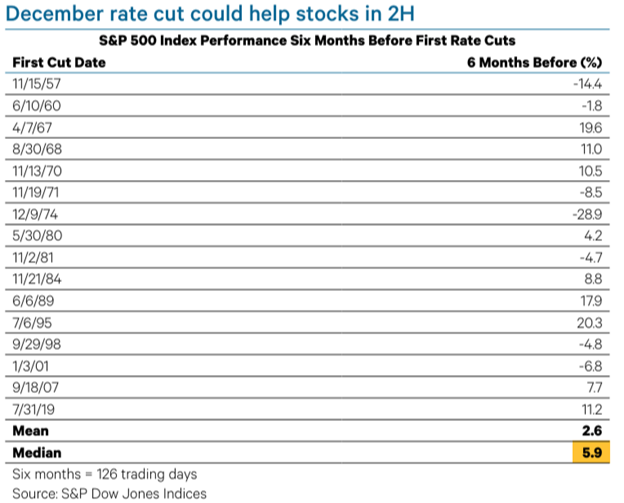
Coming into the year, consensus estimates were that the Fed would begin cutting interest rates in March. Many were confident the Fed was done hiking but not confident as to when the rate cuts would begin. Joe Kalish of NDR sees December as the most likely date of the first cut. The uptick in inflation in the first quarter has begun to recede. Thomas Lee of Fundstrat has been adamant about pointing out the reasons for inflation stickiness and that these same inflation escalators are now seemingly falling off a cliff. Recent data on retail sales, job openings, and manufacturing suggest the economy is cooling. As I mentioned earlier, steel companies, autos and insurance are reversing. The S&P 500 has risen a median of 5.9% in the six months before the start of post-war easing cycles. The risk is that the Fed chooses not to cut, either because inflation reaccelerates, or because they underestimate the severity of the economic slowdown. Below is the table that shows what the markets tend to do in the six months leading up to the first rate cut:
Divergences are harder to ignore
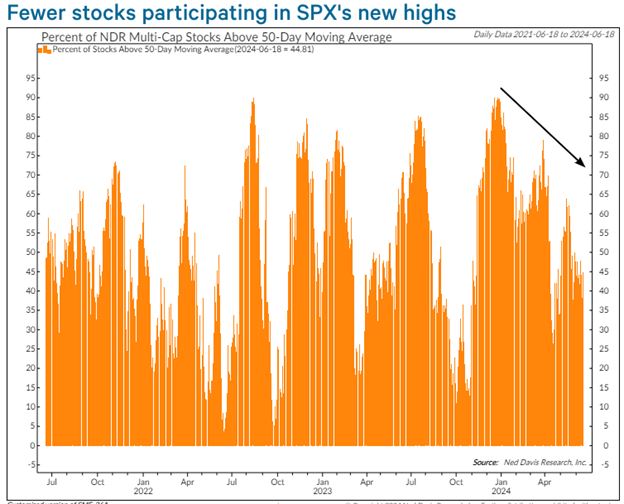
In addition to the bullish macro backdrop, the strong technical picture was a reason many analysts were bullish entering the year. Several short-term, or breadth thrust, signals fired after the October 27 low in 2022, and they were confirmed by intermediate-term and long-term breadth indicators over the following weeks.Those same technical indicators have begun to deteriorate. No breadth thrust signals have fired in 2024. At each successive S&P 500 high, the percentage of stocks above their 50-day moving averages has been lower. Even though breadth seems to currently be the biggest reason many are looking for a short-term correction to finally show itself, most technical divergences resolve themselves to the upside; however, market tops have to start from somewhere. In many cases, divergences persist for several months, with multiple new highs in the popular averages not confirmed by breadth indicators. For that reason, recent divergences need to be watched. Worsening short-term and intermediate-term breadth has not bled into long-term breadth data, at least not yet. The implication is that the market may have time to heal.
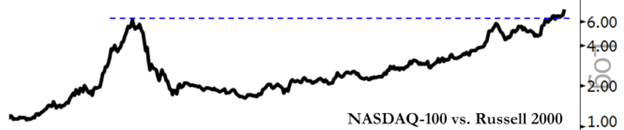
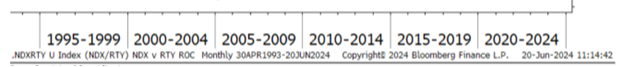
Is there a bubble forming in the Nasdaq 100?
As the saying goes, it's an uptrend if you participate, it's a bubble if your neighbor participates. The ratio of the Nasdaq 100 vs. the Russell 2000 seems to illustrate this where the bubble was in 2000, the fact that the market clearly hasn't spiked as it did in the late 90's and has instead approached this peak in a very organized fashion and is just now breaking out.
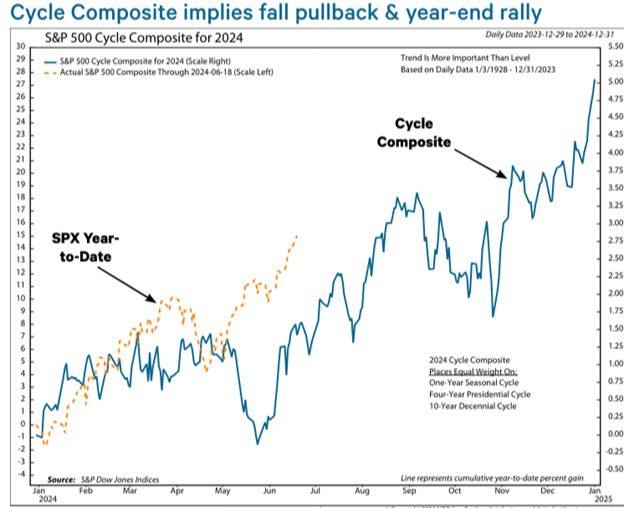
NDR’s Cycle Composite studies combine the one-year, four-year (election year), and 10-year (years end in four) historical price patterns of the S&P 500. These cycle studies tend to side with the bulls, suggesting a rally into late summer, a pullback into the election, and a year-end rally. An autumn pullback fits well time wise with potential downside earnings revisions, make-or-break decision time for the Fed, and election uncertainty. The risk is that if one or more of those catalysts prove to be longer lasting, turning a pullback into something more. Breadth indicators may give us a heads up on how severe any pullbacks become.
Growth vs. Value
Growth has tended to outperform Value during slow easing cycles as well. The issue for Growth stocks is that they are seemingly expensive relative to Value stocks. It should be remembered that this has tended to always be the case just by virtue of more aggressive earnings growth tends to be expected out of growth stocks…… until it isn’t, then wham! Hence, growth stocks are expected to produce superior earnings growth in the second half of 2024, but if they bear the brunt of downward earnings revisions, their lofty valuations could trigger a rotation into Value.
July 4th is next week. Aside from the quarter end fireworks in the markets, I don't expect many shockwaves to hit the news wires. Should something come up, we will be sure to let you know.
- Ken South, Newport Beach Financial Advisor
Get Ken's Weekly Market Commentary Delivered To Your Inbox!
.
.
.
Important Disclosures:
The opinions voiced in this material are for general information only and are not intended to provide specific advice or recommendations for any individual. To determine which investment(s) may be appropriate for you, consult your financial professional prior to investing. All performance referenced is historical and is no guarantee of future results. All indices are unmanaged and cannot be invested into directly.
All information is believed to be from reliable sources; however LPL Financial makes no representation as to its completeness or accuracy.
Investing involves risks including possible loss of principal.
The Standard & Poor's 500 Index is a capitalization weighted index of 500 stocks designed to measure performance of the broad domestic economy through changes in the aggregate market value of 500 stocks representing all major industries.
The Dow Jones Industrial Average is comprised of 30 stocks that are major factors in their industries and widely held by individuals and institutional investors.
The Nasdaq-100 is a large-cap growth index. It includes 100 of the largest domestic and international non-financial companies listed on the Nasdaq Stock Market based on market capitalization.
The Russell 2000 Index is an unmanaged index generally representative of the 2,000 smallest companies in the Russell 3000 index, which represents approximately 10% of the total market capitalization of the Russell 3000 Index.
This information is not intended to be a substitute for specific individualized tax advice. We suggest that you discuss your specific tax issues with a qualified tax advisor.