


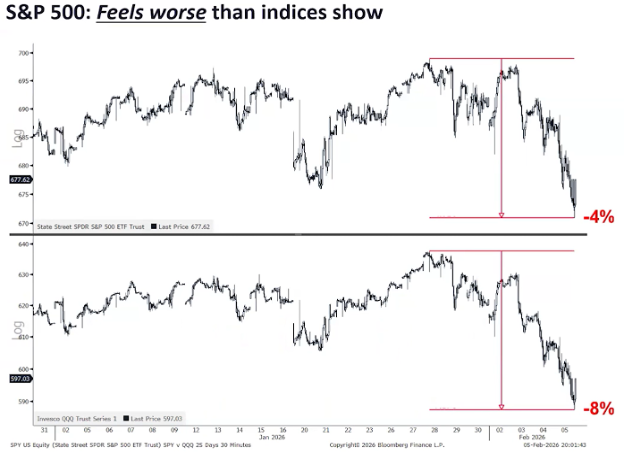
The stock market faced – and passed – another key support test last week. Even though Friday was an aggressive up day, the week still closed down for the week. This happened the previous two weeks as well. As it has done several times previously in recent months, stocks peered over the edge but managed to pull back before toppling over it. These frequent tests have been nerve-wracking and occasionally even frustrating. In today’s report, I will be illustrating the points that I am finding of interest in interpreting the action of the trees within the forest. Here is what it has looked like so far in February after a positive January. Note that the first picture is that of the S&P 500 and the second is the NASDAQ 100. Needless to say, after a plus in January, February has not been so friendly:
There is a deeply rooted economic indicator that I often mention called the ISM Index. It is a measure of manufacturing. The reason why I find it of particular interest currently is that the affect of AI on the manufacturing sector I believe is being evidenced here. This last week showed a surprise spike in the ISM reading. Although this indicator number can be somewhat volatile, this past week’s number was a significant difference from previous reports. It was the first positive reading for the ISM in 35 months. Finally positive since 2022. This is a very good economic sign. Here is what the S&P tends to do following these types of changes:
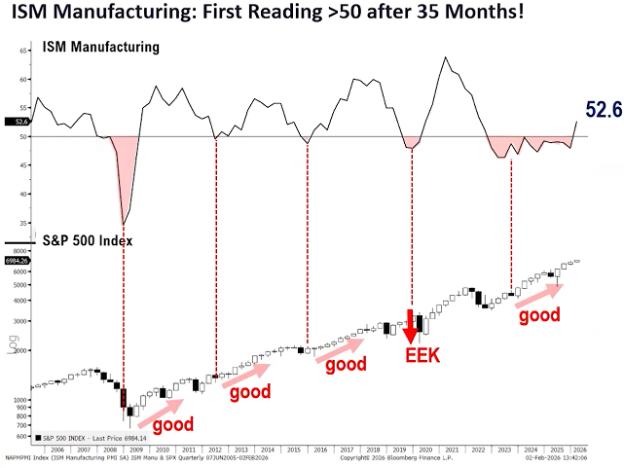
The propensity of this indicator occurring prior to up moves in the markets I found particularly interesting and of notice.
As for earnings here and now, Jeffrey Saut, of Saut Research, has always preferred to use S&P’s bottom-up 12-month operating earnings to assess the profitability of the market, so I will do so here. Currently, consensus expects S&P 500 bottom-up operating earnings to be $310.24 at the end of 2026. That represents around 16.89% earnings growth compared to the end of 2025, which is already somewhat on the optimistic side considering the average 12-month operating earnings growth on a quarterly basis over the past four years has been 7.07%. But let's say that estimate turns out to be accurate. In that case, the market is trading at a forward P/E of 22.3x, which is right in the middle of the average 5- and 10-year operating earnings P/Es of 23.4x and 21.9x, respectively. In that case, the market is probably already fairly valued at current levels compared to recent history, which implies the S&P should be trading somewhere in the 6784-7267 range. This tends to put out the flames of extreme overvaluation that many neigh sayers have been spouting off about.
This strong spate of earnings reports continues to be led by the large technology companies. Leading tech names earnings are likely far from over. Strong rotation that propelled major indices such as the broad-based NYSE Composite to new highs are not signaling a bear market. It may have felt uncomfortable given the pullback in the well-known techs, but until this decline show serious breakdowns it should just be observed. Global liquidity, which strongly correlates with major averages, remains robust. Remember, there is still over $7 Trillion sloshing around, just in the US! This suggests taking advantage of recent dips, some of which were mentioned in my recent reports, could be worthwhile. Of course, we will continue to keep a close eye on things in case recent lows are broken.
That said, the last time humanity experienced a true step-function increase in global GDP growth was during the Industrial Revolution. Railroads shrank distances and unlocked continental-scale commerce. Electricity turned night into productive time and powered factories that never slept. The internal combustion engine liberated mobility and birthed entire industries around oil, automobiles, and aviation. Together, these breakthroughs lifted average annual global economic growth from roughly 0.6% to around 3%, a 5x increase that permanently reset the trajectory of human prosperity. We are now living through something potentially larger, and it is happening in plain sight. Five exponential technology platforms are converging simultaneously:
- Robotics — machines that see, reason, and act in unstructured environments. I think this is the next big wave, and at the same time as self-driving cars.
- Energy storage — cheap, dense, scalable batteries that make renewable energy dispatchable.
- Artificial intelligence — systems that learn, plan, and create at superhuman speed.
- Multi-omics — the convergence of genomics, proteomics, metabolomics, and systems biology that unlocks programmable biology. All resulting from the AI.
Each platform is advancing on its own exponential curve. More importantly, they are beginning to reinforce one another in powerful feedback loops.
AI designs better robots and optimizes energy storage chemistry. Robotics manufactures batteries and solar panels at scale and dramatically lowers the cost of biological research equipment. Energy abundance powers the massive compute clusters that train ever-larger AI models. Multi-omics, accelerated by AI and robotics, produces the biological breakthroughs—personalized medicine, synthetic biology, longevity—that create demand for even more energy, compute, and secure value transfer. The result is not five separate exponential curves. It is a single, compound-exponential wave.
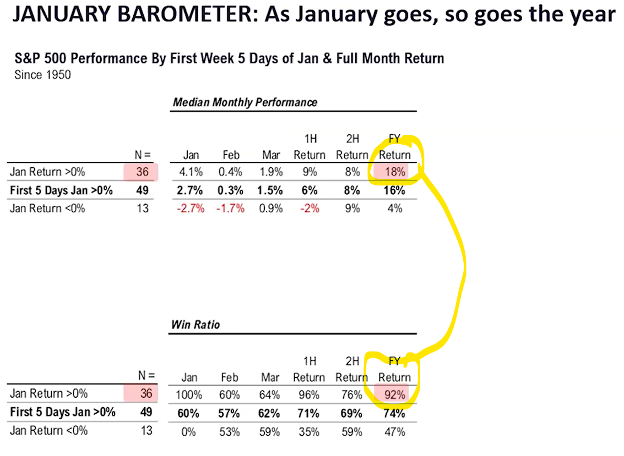
Coming back to the here and now, let’s look at the hand the markets have been dealt so far in 2026. The first two winning cards were the “Rule of the First Five Days” and the second is the “January Barometer.” Both have been positive and this is what statistically has happened since 1950. Since 1950 there have been 49 years when the first 5 days were positive and 36 years (about half) when the month of January was positive. But, when BOTH are positive, see in the table below, the annual return on the market has averaged 18% and this has occurred 92% of the time. These are pretty good odds.
This is all good and fine, but what it NOT GOOD AND FINE? The most recent is the election of the new Fed Chairman. It is not the person, it is the action. As I have said many times, the thing the markets like the least is what they don’t know. This is a “don’t know” that historically has led to short-term pullbacks in the markets. If we look at the last 13 times that a new Fed Chair has been placed in office, 10 of these 13 times have resulted in a pullback of over 10% in the Chair’s first year. Here is the graph, compliments of @markets and Barclays Equities:
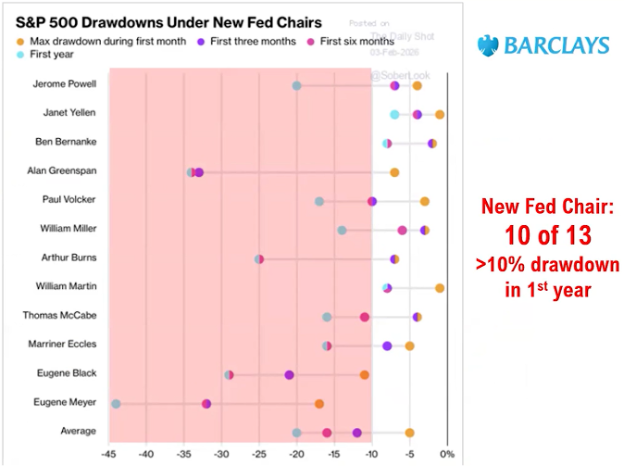
As can be seen above, almost all of these 10 resulted in what I would consider attention getting declines. What I want to be clear on is that these declines are not due to structural issues or some shock to the system, they tended to be an expectation of a possible change in decision-making. None the less, I think this is important to recognize and pay attention to.
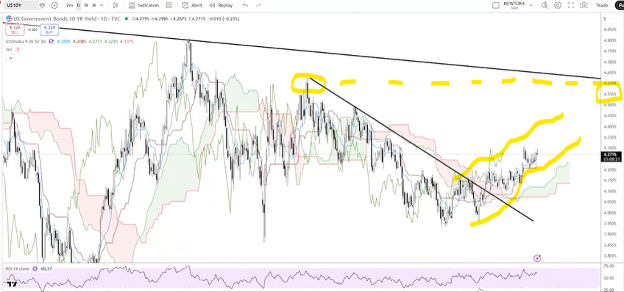
The next issue that I am paying a lot of attention to is the course of the yield on the 10-year Treasury. As can be seen below, after trending down from 2023, at the end of last year the rate seemed to have bottomed and now seems to be trending back up. Is this due to the continued economic expansion? Is this due to the exponential growth of AI? Maybe it is simply a reflex action after 6 interest rate cuts in a row by Fed Chair Powell. Whatever is the case, if rates get above the 4.5-4.6 range that I have indicated with a dotted line, this could be a negative for global equities.
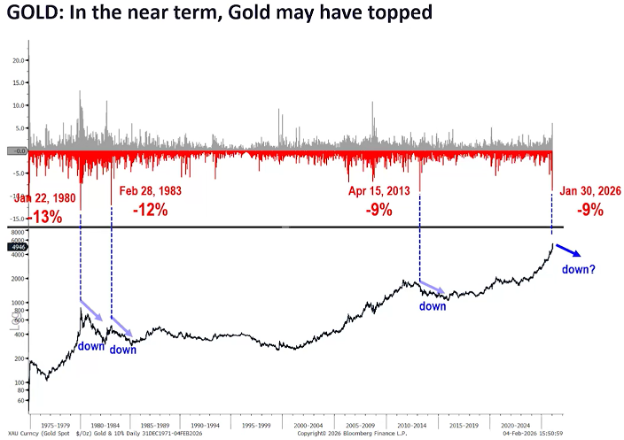
For just a moment I want to touch on Gold. According to Thomas Lee, the decline experienced a week back in Gold and Silver marked what could have been an interesting turning point. Gold has dropped 9% or more 4 times since the 1970’s. Every time it has done this it has marked a top in the price of the precious metal for an extended period of time. Will this time be any different? I don’t know, but the move up that has been experienced, in the face of falling inflation and a pretty stable US Dollar makes me think that we could have seen the top for a bit of time.
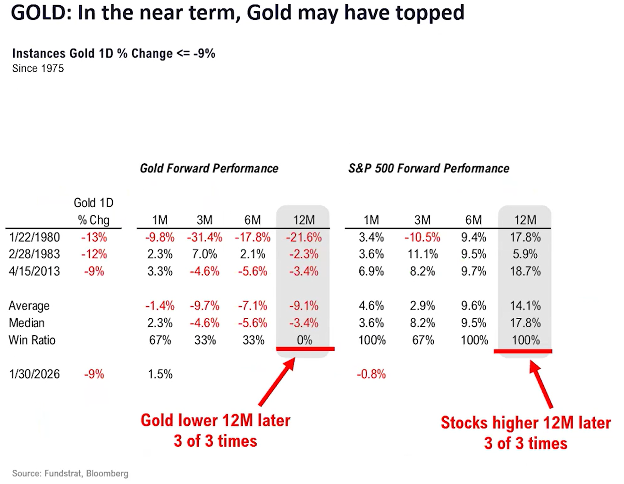
Besides Gold possibly having put in at least a short-term top, it often is making a statement about stocks as well. When gold has been down over 9% in a day, which it has now done three previous times, 12 months later it has been lower. Stocks on the other hand have benefited from the money coming back into the equity markets 100% of the time with an average return of almost 18% one year later. This doesn’t mean that it has to happen, but if history is a precedent, this is another statistic that I am going to at least pay attention to:
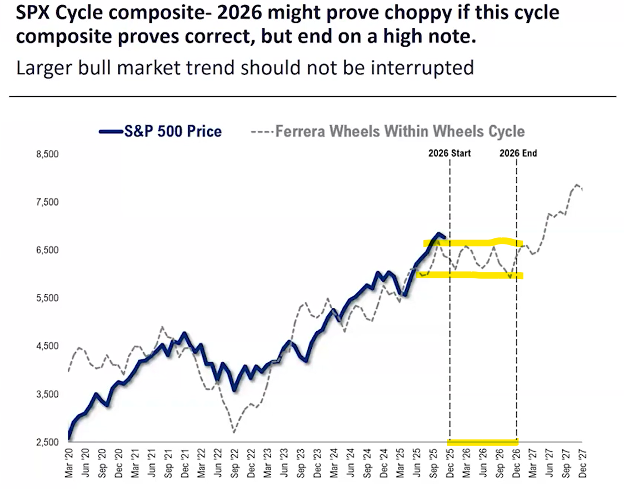
In closing, I want to make it clear that I am expecting 2026 to be a bit more challenging throughout the year than 2025 was. Remember that last year started out tough with the “Tariff Tussle” and then recovered and ran to double digit gains. If history is any precedent from various statistics, 2026 could be fairly solid into mid-year, experience some difficulty when the new Fed Chair is installed and during the voting of the Mid-term elections and then finish strong. Below is how it could possibly look. I have noted the massive tug-o-war that seems to be expected by some cycle analysts:
Oh, and one last note, remember, this weekend is Valentine’s Day. Please don’t forget to show appreciation to your Valentine!

- Ken South, Tower 68 Financial Advisors, Newport Beach
-
Get Ken's Weekly Market Commentary Delivered To Your Inbox!
Important Disclosures:
The opinions voiced in this material are for general information only and are not intended to provide specific advice or recommendations for any individual. To determine which investment(s) may be appropriate for you, consult your financial professional prior to investing. All performance referenced is historical and is no guarantee of future results. All indices are unmanaged and cannot be invested into directly.
All information is believed to be from reliable sources; however LPL Financial makes no representation as to its completeness or accuracy.
Investing involves risks including possible loss of principal.
The Standard & Poor's 500 Index is a capitalization weighted index of 500 stocks designed to measure performance of the broad domestic economy through changes in the aggregate market value of 500 stocks representing all major industries. The S&P 500 is a stock market index tracking the stock performance of 500 of the largest companies listed on stock exchanges in the United States. Indexes are unmanaged and cannot be invested in directly.
The Dow Jones Industrial Average is comprised of 30 stocks that are major factors in their industries and widely held by individuals and institutional investors.
The Nasdaq-100 is a large-cap growth index. It includes 100 of the largest domestic and international non-financial companies listed on the Nasdaq Stock Market based on market capitalization.
The Russell 2000 Index is an unmanaged index generally representative of the 2,000 smallest companies in the Russell 3000 index, which represents approximately 10% of the total market capitalization of the Russell 3000 Index.
Data sourced from Bloomberg (2025).
Stock investing includes risks, including fluctuating prices and loss of principal.
Bonds are subject to market and interest rate risk if sold prior to maturity. Bond values will decline as interest rates rise. Bonds are subject to availability, change in price, call features and credit risk.
Government bonds are guaranteed by the US government as to the timely payment of principal and interest and, if held to maturity, offer a fixed rate of return and fixed principal value.
Bond yields are subject to change. Certain call or special redemption features may exist which could impact yield.
International investing involves special risks such as currency fluctuation and political instability and may not be suitable for all investors.
Alternative investments may not be suitable for all investors and should be considered as an investment for the risk capital portion of the investor’s portfolio. The strategies employed in the management of alternative investments may accelerate the velocity of potential losses.
This information is not intended to be a substitute for specific individualized tax advice. We suggest that you discuss your specific tax issues with a qualified tax advisor.
The economic forecasts set forth in this material may not develop as predicted and there can be no guarantee that strategies promoted will be successful.
LPL Tracking #1063321