


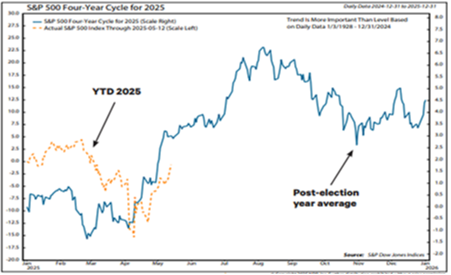
As May came to a close, so did the most volatile period that has been the norm for a new president. In looking in retrospect, the first quarter is normally a very difficult time for both equity and bond markets as the institutional managers are trying to handicap what is to be expected of the new administration. To say that this one was even more difficult due to the truly “different” style of President Trump is a gross understatement, but I believe this is part of the reason why his market affect was even a more pronounced move than the normal first quarter move. What I did find truly amazing was that the high this year was within two weeks of the average high date back to 1928 and the low date in April was within four days! Wow! Truly amazing that every president all the way back to 1928 suffers the same market flu when they get in office.
Bloomberg. (2025). S&P 500 Zones of Interest chart. Bloomberg. https://www.bloomberg.com
So now that we have this behind us what is next? This is of course the next logical question. To answer this, I often take a moment to look at most recent market action and then think about where we’ve come from and what it might take to take us to where we might go next. I begin by sort of checking off the boxes on the currency market and the bond market as they are far larger than the equity market and then to a lesser degree the gold/ oil / crypto markets since they can often provide a measure of risk temperament:
- US Dollar- the new term is “US Exceptionalism.” I take this to mean the challenge to global respect to American businesses and how the liberal leaning media is saying that this has been destroyed due to the actions of Trump. The measure is how the US Dollar is moving relative to other major currencies like the Euro, and as it stands we are still locked in a normal range. Nothing has really changed to take notice to.
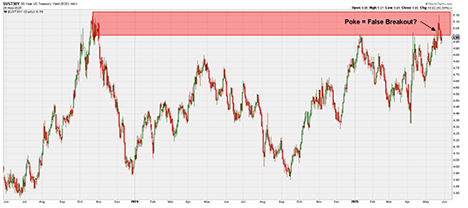
- US Interest rates- Long-Term Rates Trying to Accelerate but Keep Fading Above 5% I've mentioned the risk of long-term interest rates shooting higher as a result of rising inflation expectations and concerns about the fiscal stability of the United States. I am certainly not the only one drawing attention to this, however. I rarely like being on the same side of overwhelming consensus opinion (which is almost always wrong at major turning points), so it is interesting that the 30-Year U.S. Treasury yield has now attempted to break above 5% on two occasions recently but pulled back almost immediately afterward both times. It's likely hitting some resistance from the highs of late 2023. Right now, it's not enough to start actively betting on lower rates, but if we do continue to see rates hold below 5%, we'll have to start entertaining the possibility that rates might surprise to the downside. Again, still staying in a range.
Bloomberg. (2025). US Dollar Index movement chart. Bloomberg. https://www.bloomberg.com
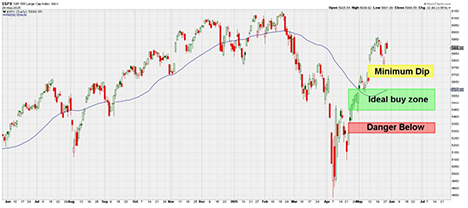
US Equity market- S&P 500 Zones of Interest. I've tried to illustrate in the chart below sort of where my head is at in terms of viewing possible opportunities in the market based on the S&P 500. The upper yellow zone is sort of the minimum area in which I'd consider buyable without feeling like I'm chasing the market. It was threatened last week, but that obvious gap from earlier this month was not fully closed and the 50-DMA was never threatened. I'd prefer to see a deeper drop that accomplishes these things while getting the S&P down closer to the 5450-5600 region where I feel more major support sits. This would be the ideal "buy zone" in my opinion. As long as the index remains above all of these zones, the risk of having to sit through a larger pullback will be more elevated if choosing to chase stocks higher. Looking at the period from November of last year till the high point in February, this is going to be a somewhat difficult congestion area to “chew” through in order to get to new highs. I believe this is why the market is sort of locked in a tight tug-o-war range right now, needing more information before it breaks one way or the other. Will it be a settling of tariffs? An end to a war? Or some wonderful global kumbaya, I of course have no way of knowing. But GDP is good, inflation is good, and earnings are good, so what is not to like other than short-term valuations?
Bloomberg. (2025). 30-Year Treasury Yield chart. Bloomberg. https://www.bloomberg.com
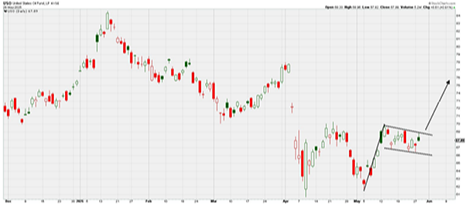
As for the alternative asset classes- Gold seems to be consistently gaining traction as an alternative to the US Dollar but not an abnormal advance. Oil is remaining tame from the mid $50’s to the mid $60’s. Fossil fuels aren't going away anytime soon, however, whether we want them to or not. So I am keeping an eye on Oil here. It has had some "flaggish" action recently, and a break over $69 in USO (roughly $63 in WTIC) could trigger another push upward to possibly close those obvious gaps from early April. At the moment, it's more of a speculative setup but one worth monitoring since I see almost no one talking about Oil and the few who believe it's only going lower. See chart below. And Crypto seems to be following gold yet not on an out-of-control advance. Again, things are moving at a measurable pace.
Bloomberg. (2025). Oil price flag pattern chart. Bloomberg. https://www.bloomberg.com
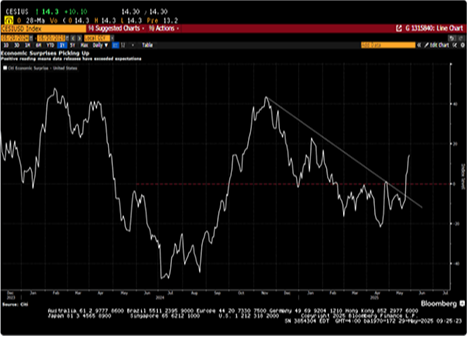
It might seem ironic to some that Citigroup's Economic Surprise index bottomed in April at the time of the Administration's "Liberation Day" announcements. Thus, economic data has been trending better than expectations over the last seven weeks, which has resulted in a breakout in this index. This is a good sign, but yet better than expected Economic strength has not led Interest rates back to new highs. The stock market seems to be in a sweet spot at present where Earnings and good economic strength coupled with strong momentum out of Technology, has been able to carry Stock indices higher, despite the On-again, Off-again rhetoric on tariffs which has much of the investing public captivated and under-exposed to Equities. This is what I think could be the thing that blows the lid off the market and allows it to chew through this upper range to new highs.
Bloomberg. (2025). Gold vs. Crypto performance chart. Bloomberg. https://www.bloomberg.com
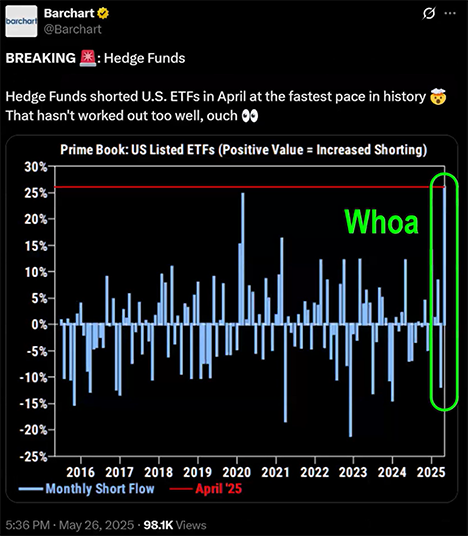
Another catalyst could me the short interest of institutions have been rising and if these prove to be a poor decision, covering of the shorts could provide a jolt to the upside.
Bloomberg. (2025). Citigroup Economic Surprise Index chart. Bloomberg. https://www.bloomberg.com
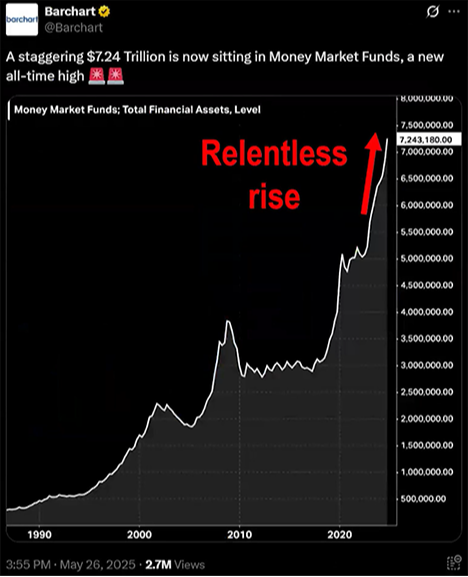
And then there is my favorite, the amount of cash still sloshing around wanting a long-term home. It has now grown to a staggering $7.24 Trillion. Talk about a boat load of fire power!
Bloomberg. (2025). Institutional short interest chart. Bloomberg. https://www.bloomberg.com
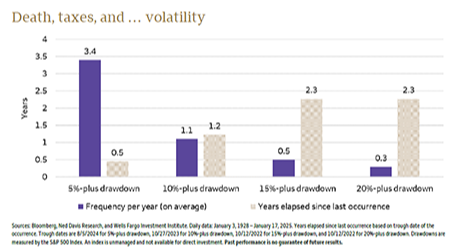
In closing, I want to reprint a chart that has been tattooed my brain. It is the normal number of times that markets correct in the general course of action. The correction that we experienced came right on schedule as the Presidential chart above telegraphed, and right on schedule with what is normal in time. As far as I can see, this is a really normal market environment, and one not to be scared of but instead always one to be respected and observed with great discipline.
Bloomberg. (2025). Historical market correction frequency chart. Bloomberg. https://www.bloomberg.com
- Ken South, Tower 68 Financial Advisors, Newport Beach
-
Get Ken's Weekly Market Commentary Delivered To Your Inbox!
Important Disclosures:
The opinions voiced in this material are for general information only and are not intended to provide specific advice or recommendations for any individual. To determine which investment(s) may be appropriate for you, consult your financial professional prior to investing. All performance referenced is historical and is no guarantee of future results. All indices are unmanaged and cannot be invested into directly.
All information is believed to be from reliable sources; however LPL Financial makes no representation as to its completeness or accuracy.
Investing involves risks including possible loss of principal.
The Standard & Poor's 500 Index is a capitalization weighted index of 500 stocks designed to measure performance of the broad domestic economy through changes in the aggregate market value of 500 stocks representing all major industries.
The Dow Jones Industrial Average is comprised of 30 stocks that are major factors in their industries and widely held by individuals and institutional investors.
The Nasdaq-100 is a large-cap growth index. It includes 100 of the largest domestic and international non-financial companies listed on the Nasdaq Stock Market based on market capitalization.
The Russell 2000 Index is an unmanaged index generally representative of the 2,000 smallest companies in the Russell 3000 index, which represents approximately 10% of the total market capitalization of the Russell 3000 Index.
Data sourced from Bloomberg (2025).
Stock investing includes risks, including fluctuating prices and loss of principal. (132-LPL)
Bonds are subject to market and interest rate risk if sold prior to maturity. Bond values will decline as interest rates rise. Bonds are subject to availability, change in price, call features and credit risk. (116-LPL)
Government bonds are guaranteed by the US government as to the timely payment of principal and interest and, if held to maturity, offer a fixed rate of return and fixed principal value.
Bond yields are subject to change. Certain call or special redemption features may exist which could impact yield.
This information is not intended to be a substitute for specific individualized tax advice. We suggest that you discuss your specific tax issues with a qualified tax advisor.