


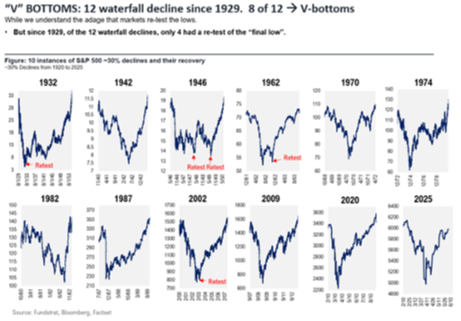
The S&P 500 set fresh all-time highs on June 26, and again on June 30. For the first half of the year, the S&P 500 gained 5.5%. June was a good month for U.S. stocks, with the S&P 500 having risen 5% and the Nasdaq Composite climbing 6.6%. The record closes were not surprising to us. Since 1929, waterfall declines in non-recession markets, such as the one we experienced after the April 2 “Liberation Day,” have typically been followed by V-shaped rallies. Including this year, this has now happened eight out of 12 times:
Similar to the prior month, the best performing sector in June was Technology. These were predominately the large companies, like the Magnificent 7 stocks. The defensive sectors lagged behind the rest of the market as the threat of a recession has been almost forgotten. The economic indicators are continuing to show strength, yet not overzealous or slowing momentum.
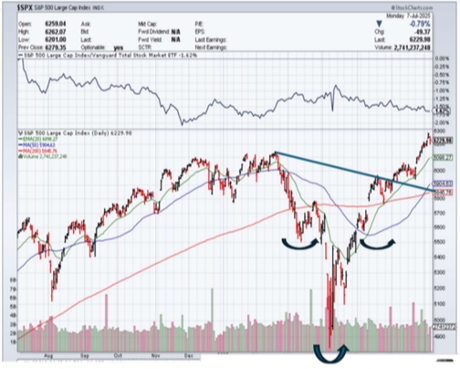
Yet even though stocks have climbed 20% in the roughly 12 weeks between the April 8 bottom and June 30, this remains one of the “most hated V-shaped rallies”. Smaller retail investors appear to have embraced the rally, but institutional and high-net-worth individual investors remain skeptical and largely planted on the sidelines.What we see is a giant, if not perfect, “head-and-shoulders” bottoming formation, which is quite bullish. In fact, according to Jeffrey Saut of Saut Research, he projects the size of the pattern up above the breakout point (achieved last week). He calculates the S&P 500 index ultimate “target” of around 7,180 by his pencil. So, the secular bull market still looks alive and well.
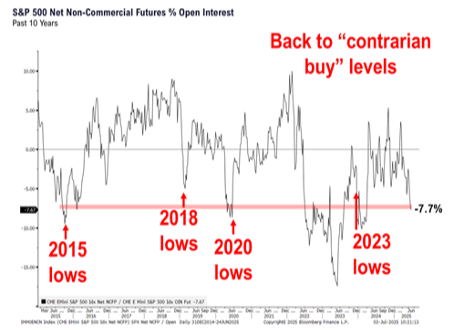
We can see this in the S&P 500 futures positioning of hedge funds, with net short levels at the lowest levels in the past 12 months. This is noteworthy, because in the last 10 years, such levels have tended to serve as contrarian buy signals:
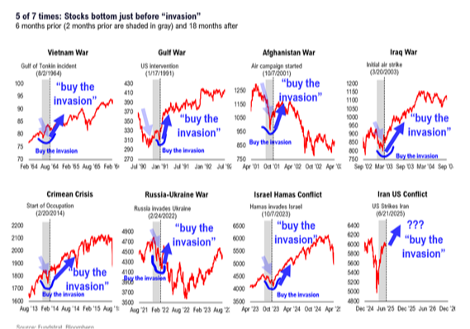
This may seem quite foreign in concept, and it should be! It would be logical to think that the institutional side of the investment community would be far more intuitive and prepared, but this has not been the case. This of course can change but suffice it to say that they have missed most of this move off the lows. This metrics (plus others such as the amount of cash on the sidelines) arguably explain why, despite the volume of “noise” that boosted investor certainty this month, the pullbacks have been both shallow and transitory. This was the case at the beginning of June, when President Trump and Elon Musk clashed on social media over the president’s proposed budget, and it was also the case during Israel’s June 13 attack on Iran and subsequent escalation in Mideast tensions. (It’s worth reiterating that, as we have written before, wars and related events have human consequences, and of course they dominate headlines. However, they have little impact on equity markets in the medium- and long-term). See below the actions of the markets coming out of conflicts. With this most recent conflict seeming more like an almost overnight squirmish, the markets left virtually unaffected.
The Fed & Tariffs
The Fed’s argument for holding rates steady at 4.5%, while other central banks like the ECB are cutting, is that it needs to be cautious due to uncertainty around tariffs. After the June 18 meeting of the Federal Open Market Committee, Fed Chair Jerome Powell told reporters that “everyone that I know is forecasting a meaningful increase in inflation in coming months from tariffs because someone has to pay for the tariffs.” The tariff situation remains unresolved as of this writing, but no matter how it turns out, we view it as unlikely to have a significant impact on inflation. Many, including some at the Federal Reserve, disagree. However, our view is based on the fact that tariffs are a tax, and taxes do not create inflation.
Looking forward
Heading into July earnings season, our view is that we are in a bull market phase. To us, the investment outlook is better now than it was in February 2025, when stocks last peaked.
- Visibility on tariffs, tax, and deregulation continues to improve. This along with a positive outcome- at this point on many of Trump’s initiatives helps make possible unknowns more palatable.
- Companies have survived their fifth major stress test (the first four were the 2020 COVID shutdown, followed by the 2021 bullwhip supply-chain shock, the 2020 inflation cycle, and the Fed rate-hike cycle).
- The Fed is still dovish, both now and in 2026. The Fed continues to look for reasons to ease rates, as Trump continues to push so as to decrease the cost of the Federal debt, but unless the data provides the reasons to cut rates will remain as they are.
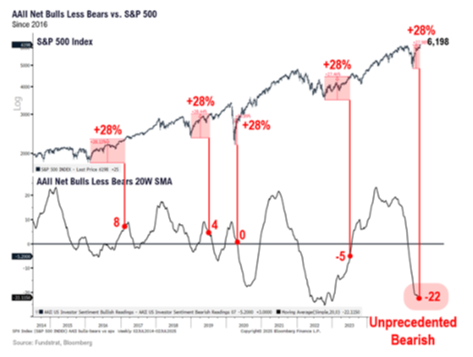
Sentiment also favors a constructive view. Consider that stocks just advanced 28% from April lows. In similar historic precedents, a 20-week simple moving average of sentiment as measured by American Association of Individual Investors sentiment has never been this bearish. Specifically,
- Spring 2017: +8% (AAII net bulls, 20-wk avg)
- Summer 2019: +4%
- Spring 2020: +0%
- Spring 2023: -5%
- June 2025: -22%
June 2025 is a huge outlier compared to other years. See below how the S&P has reacted after such negative investor sentiment:
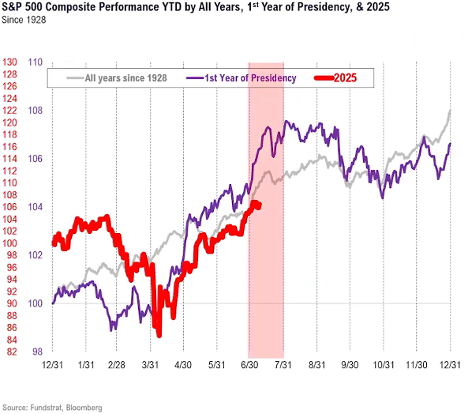
The last point that I wanted to cover is the seasonality factor which also favors a constructive view for July. I brought this up last week, but I feel that it deserves a repeat as there seems to be sort of a flat spot in economic indicators and earnings reports. When looking at the first year of a presidential term, July has the highest median returns (2.4%), with a win ratio of 67%. This isn’t a tremendously convincing statistic, but I will take it all the same.
In closing, Trump seems to be working hard on completing his tariff demands. At the same time, due to the tariffs the US is currently generating $38 Billion a month in additional revenues. This is instead of taxes. Many argue that tariffs are a tax to the consumer, but this is not translating into the CPI or PPI, so I believe that most companies built in the changes before they were implemented. As for interest rates, they seem to be locked in a range which Powell needs a crowbar to get out of without sufficient data to make a change. So that leaves us with overall stock prices. They are progressing quite well and should earnings and earnings projections come out well higher prices could be the future, at least into the fall. The closing statistical chart that I will leave you with is the one that compares all first years of a presidency to all years going back to 1928. The last line is the red one that is this year, 2025. I have shaded the month of July to show what has been the case historically. If this July is anything like the past, we could still have pretty positive action going forward:
- Ken South, Tower 68 Financial Advisors, Newport Beach
-
Get Ken's Weekly Market Commentary Delivered To Your Inbox!
Important Disclosures:
The opinions voiced in this material are for general information only and are not intended to provide specific advice or recommendations for any individual. To determine which investment(s) may be appropriate for you, consult your financial professional prior to investing. All performance referenced is historical and is no guarantee of future results. All indices are unmanaged and cannot be invested into directly.
All information is believed to be from reliable sources; however LPL Financial makes no representation as to its completeness or accuracy.
Investing involves risks including possible loss of principal.
The Standard & Poor's 500 Index is a capitalization weighted index of 500 stocks designed to measure performance of the broad domestic economy through changes in the aggregate market value of 500 stocks representing all major industries. The S&P 500 is a stock market index tracking the stock performance of 500 of the largest companies listed on stock exchanges in the United States. Indexes are unmanaged and cannot be invested in directly.
The Dow Jones Industrial Average is comprised of 30 stocks that are major factors in their industries and widely held by individuals and institutional investors.
The Nasdaq-100 is a large-cap growth index. It includes 100 of the largest domestic and international non-financial companies listed on the Nasdaq Stock Market based on market capitalization.
The Russell 2000 Index is an unmanaged index generally representative of the 2,000 smallest companies in the Russell 3000 index, which represents approximately 10% of the total market capitalization of the Russell 3000 Index.
Data sourced from Bloomberg (2025).
Stock investing includes risks, including fluctuating prices and loss of principal.
Bonds are subject to market and interest rate risk if sold prior to maturity. Bond values will decline as interest rates rise. Bonds are subject to availability, change in price, call features and credit risk.
Government bonds are guaranteed by the US government as to the timely payment of principal and interest and, if held to maturity, offer a fixed rate of return and fixed principal value.
Bond yields are subject to change. Certain call or special redemption features may exist which could impact yield.
International investing involves special risks such as currency fluctuation and political instability and may not be suitable for all investors.
Alternative investments may not be suitable for all investors and should be considered as an investment for the risk capital portion of the investor’s portfolio. The strategies employed in the management of alternative investments may accelerate the velocity of potential losses.
This information is not intended to be a substitute for specific individualized tax advice. We suggest that you discuss your specific tax issues with a qualified tax advisor.
LPL Tracking #768893