


Every week I “attempt” to do a few things with my weekly musing. First, I want the reader to come away feeling like they have at least a few more pearls of wisdom about the financial markets. Second, I want to relay information about how to interpret the current environment and how to read / see through the media hype to have a clearer and deeper understanding about why financial assets are moving the way they are. Last, I try and look at history to provide some statistical data that doesn’t pay attention at all as to what the supposed reasons for why prices are moving as they are, but instead to know what could be expected going forward based on history. This week has been particularly challenging. We have dealt with tariffs in 2018, but not on the tail end of one of the largest market advances in many years. I surely couldn’t have handicapped the tariff issue, and I don’t believe that a recession is in the cards, but I cannot ignore a significant and painful decline when it occurs.
Tariff is a word most of us first heard in high school history class. We remember something about the Smoot-Hawley Tariff Act of 1930, the Great Depression and the dark side of protectionist trade policy. Many forget that up until 1913, tariffs were the source of money to fund the US Government! Fast forward to today and tariffs are once again taking center stage, serving as the linchpin (or the lynching) of President Trump’s trade policy – and as a cause of sharply rising market volatility. A fierce debate has emerged over the impact they could have on the global economy. Critics argue these tariffs mark the start of a new trade war that will hurt all countries in the end. Supporters say it’s an attempt by the U.S. to reduce long-term trade deficits and compel other countries to lower their own protectionist measures. To help make sense of it all, I’ve tried to separate the different implied aspects of the tariffs and their potential implications for the economy, markets and investors. I am sorry to spend so much time on this, but if people believe that the economy and the markets are going to be drug along by the tariffs, then understanding a bit more about them should be important.
How have tariffs affected the stock market?
Investors may be experiencing déjà vu as tariffs make headlines. The first Trump administration’s tariffs on China sparked a trade war that whipsawed markets and dominated the news, much like now.
How did markets respond? Volatility rose in 2018, driven by the trade war and a slowdown in China’s economy, causing the S&P 500 Index to fall 4.4%. But the index recovered sharply in 2019, up 31.1%, as trade deals were announced, and consumer spending remained steady. In both years, inflation was muted in the aggregate, with the annual consumer price index ranging from 1.50% to 2.85%.
The world has changed since that initial round of tariffs. How tariffs and federal spending cuts will affect growth is even more uncertain given the evolving nature of Trump’s policies. The lesson may be that in times like these, it’s important to be clear about what we do and don’t know — recognizing that tariffs are just one part of the equation.
In the end, we believe that these tariffs are a negotiating tool. The administration does not want to slow economic growth, increase inflation of prices or create friction with our trading partners. Instead, we are seeking equality. Post World War II we did what we could to help the world rebuild. Now it is a function of global equality. Is it fun? No, of course not, negotiations never are. Is the action fair and for the right reasons? We believe so, but getting there, well, this isn’t fun.
The Conference Board 1-year expectation for probability of stock price increase is now at lowest level in some time, and the amount of decline in this indicator over the last two months is the largest decline ever. This indicator goes back 40 years. If we dial this down in time period to the last 10-years, it can be seen that this is even a worse decline than the previous Trump tariffs in his first administration and lower than the COVID crush.
At the end of the day, this all comes back to confidence. Both investor and business confidence.
- The risk is that enough damage has been done to both from the blitzkrieg of Helter- Skelter policies that a quick return to normalcy requires some time to heal.
- And such time will likely prevent a V-shaped recovery in the real economy and asset prices that many might like to see.
So, what will it take to see a meaningful recovery? Good question.
- A reversal of the tariff policy would be a good place to start. Or at least a significant overhaul. This might mean this 90-day extension period to give time for negotiations.
• The idea was to start aggressively with expectations to force countries to come to the negotiating table.
• But that doesn’t seem to be the case. It may still be early, but we’ve seen more reciprocal tariffs than countries looking to negotiate.
• And expecting the Trump Administration to back down from here is unlikely, given the associated perception of a weak bluff.
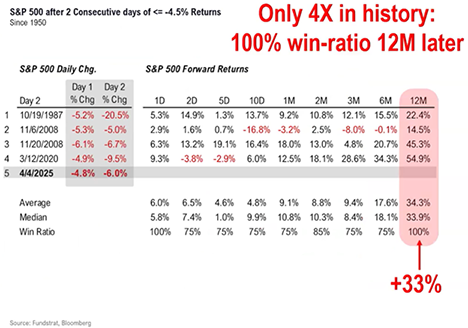
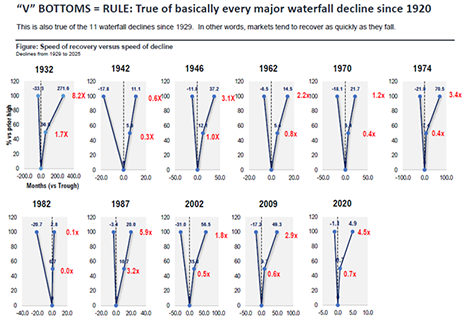
In the end, the market is the market. It is a living breathing thing that has caught a cold and needs to get through it. In looking at the decline we have experienced so far, this is not a never-before-seen event. It is instead a never before “reason” for the markets to act as they have. Often markets don’t need a reason to do this or that, instead, they simply run out of gas moving in the direction that they have. In an attempt to see if two days in a row where the markets have dropped more than 4.5% in two days consecutively, I find this factoid. 100% of the time the markets are higher a year later. And higher by a big number. When COVID hit in March of 2020, the markets were down big for two days and a year later up 54.9%. I am clearly not saying that this is what is expected, but in looking at the table below, markets do recover:
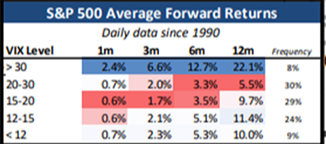
Another measure is the VIX (Volatility Index) as can be seen below, on Monday of this week the VIX hit 60. This is really quite an extreme. Going back 10 years, the only other time that this number was hit was on March of 2020, COVID. It doesn’t necessarily mean that a decline is over, but the veracity of the decline could be hitting its high point. I find this interesting at this time as the tariff issue is one of negotiating, but not an ending of economic expansion. It is true that the GDP number from last week, the labor numbers and the wage numbers are all backward looking, but there have been no signs of economic contraction. Our economic growth could slow, but I don’t think it will reverse.
Now that I have sufficiently bummed everyone out about the big picture, some good news is that in the short-term signs are beginning to pile up that have historically marked selling climax lows. Both Thursday and Friday were effectively 90% downside days as volume spiked across the market. The S&P 500 saw over $100 Billion in volume on Friday, its 3rd biggest day ever. This crash has left only about 4% of NYSE operating companies above their 10-day moving averages and only 10% above the 50-day moving average, which is about as bad as it ever gets and usually leads to some sort of oversold bounce. And the major averages are certainly oversold, with all of them trading substantially beneath their 50-day moving averages on Friday. While we have yet to really get much of a bounce at all during the decline, I think we must be on alert for one to begin at any time, particularly with the SPX retracing 50% of the up move that has been enjoyed since October of 2022. I bring this number up because this is often the case within a remaining and longer-term uptrend. The low to this decline might not be in yet, but the probabilities favor some sort of larger bounce to begin this week. I keep asking myself two questions that the media has failed to address:
- How much of this decline was due to foreign sovereign wealth funds and investment pools pulling money from US companies due to the tariff issue?
- How much effect will all the cash on the sidelines have when rationality creeps into the discussion and it is understood that this is a difficult negotiation that will ultimately be completed?
Here is how waterfall declines have played out historically, all the way back to the 1930’s. What is interesting is that this has been true in basically every waterfall decline, of which there have been 11 of them. Also, it should be noted that this one has been the third worst since World War II.
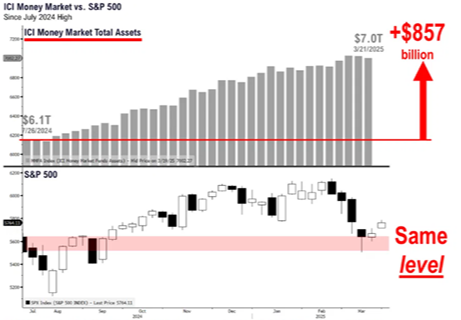
This is all good and fine, and historical, but most importantly, “this time” will always be different. I believe that the computer-generated trading has reached a volume of trading that is creating even higher volatility. On top of this, I keep thinking about the amount of cash that has been amassed on the sidelines that should not only allow consumption to protect us from entering a recession due to emotional confidence. If even the interest earned from the last year is invested in the equity markets, it could have a sizable effect. See below the amount of cash on the sidelines that will want more than a 3.5-4.5% return on investment for the longer term.
We are in uncharted territory. This is a most difficult market environment to navigate. I find it best to stick with quality, leading companies, that are in the way of where the world is going. In the end, we will continue to battle lines at Costco. We will continue to use our I-phones, we will continue to watch movies on Netflix. Keep watching this movie.
- Ken South, Tower 68 Financial Advisors, Newport Beach
-
Get Ken's Weekly Market Commentary Delivered To Your Inbox!
Important Disclosures:
The opinions voiced in this material are for general information only and are not intended to provide specific advice or recommendations for any individual. To determine which investment(s) may be appropriate for you, consult your financial professional prior to investing. All performance referenced is historical and is no guarantee of future results. All indices are unmanaged and cannot be invested into directly.
All information is believed to be from reliable sources; however LPL Financial makes no representation as to its completeness or accuracy.
Investing involves risks including possible loss of principal.
The Standard & Poor's 500 Index is a capitalization weighted index of 500 stocks designed to measure performance of the broad domestic economy through changes in the aggregate market value of 500 stocks representing all major industries.
The Dow Jones Industrial Average is comprised of 30 stocks that are major factors in their industries and widely held by individuals and institutional investors.
The Nasdaq-100 is a large-cap growth index. It includes 100 of the largest domestic and international non-financial companies listed on the Nasdaq Stock Market based on market capitalization.
The Russell 2000 Index is an unmanaged index generally representative of the 2,000 smallest companies in the Russell 3000 index, which represents approximately 10% of the total market capitalization of the Russell 3000 Index.
This information is not intended to be a substitute for specific individualized tax advice. We suggest that you discuss your specific tax issues with a qualified tax advisor.