


As we already are about to turn the page on January, and commentary out of the GOP continues at a fever pitch, actions seem to be more emotionally based than economically based as Alan Greenspan so eloquently said in his “Irrational Exuberance” quote. To think that this quote was 30 years ago seems to again speak to how history often repeats itself.
Alan Greenspan used the phrase "irrational exuberance" in a December 5, 1996, speech to question whether investor enthusiasm had driven asset prices too high, potentially creating a speculative bubble. The remark was widely interpreted as a warning about the overvalued stock market during the dot-com bubble of the 1990s.
Key Insights
- Meaning: "Irrational exuberance" refers to a widespread, undue economic optimism where investor enthusiasm drives asset prices above their fundamental value, often leading to market bubbles. This is a fancy way of saying that the irrationality of investors is amplified when coupled with economic strength or market price extremes.
- Context: In his speech, "The Challenge of Central Banking in a Democratic Society" at the American Enterprise Institute, Greenspan asked, "How do we know when irrational exuberance has unduly escalated asset values, which then become subject to unexpected and prolonged contractions...?".
- Immediate Reaction: Stock markets initially dropped after the comment, with the Dow Jones Industrial Average falling more than 1% the next day. However, markets quickly recovered.
- Long-Term Impact: Despite the warning, the stock market continued to climb for over three years, with the S&P 500 more than doubling before the dot-com bubble finally burst in March 2000. Greenspan did not significantly tighten monetary policy until the bubble was well underway.
So where are we today? Cleary we have markets at new highs. I’m not just referring to technology stocks (which haven’t collectively moved much of anywhere since late September) but most all US indexes, international indexes, and emerging market indexes. This is truly financial exuberance. Is it unwarranted? NO! Domestic and foreign GDPs and corporate revenue and earnings growth clearly supports the exuberance.
What is bothering me is interest rates. This is one of the four things I am paying attention to that I explained last week. I believe that bonds are the trade-off to stocks for domestic investors, and if there is a significant move in interest rates, this often has a direct and immediate affect on stock prices. On Tuesday of this week, after a holiday weekend, this is what the interest rate on the 10-year US Treasury did:
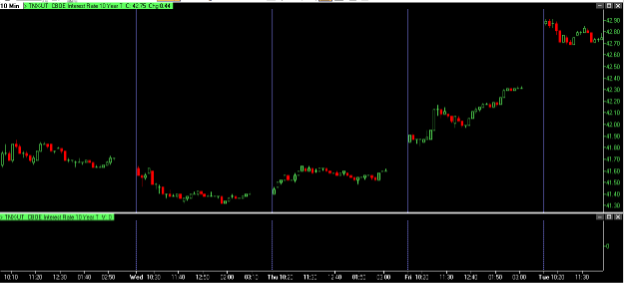
For the last few trading days, the yield went from being quiet to slowly rising and then on Tuesday it jumped out of a range it had been in for months. This is a major change as it adjust the cost of funds that are borrowed for houses and makes already expensive homes even more unaffordable. This is particularly important when we then look at student loans and credit card loans. I think that the student loan debt is indicative of the opinions and job solidarity of this swath of our economy, and credit card debt is indicative of the current situation with middle to lower income consumers. Here is how they sit currently:
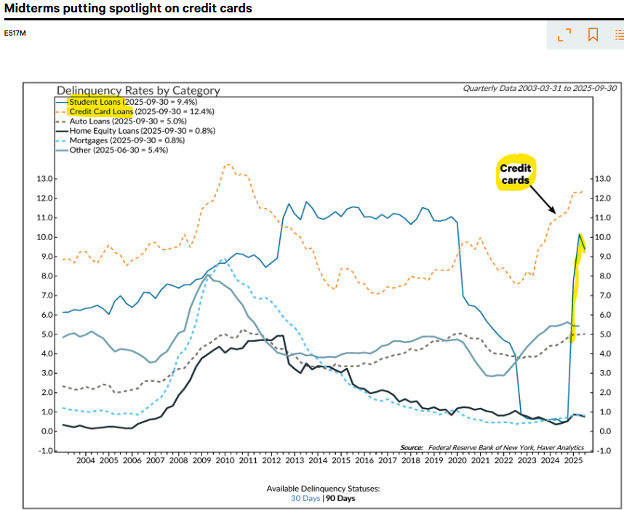
This tells me that money is really getting tight for the younger consumer with student loan debt and for the middle to lower income consumer who are needing credit to meet financial needs for their consumption. This tends to be negative for the emotional construct of the economy. Hence, volatility in prices can expand.
Another phenomenon that I am observing is a sort of “changing of the guard” in the US equity markets. Since the 2022 bear market lows, the mega-cap Growth Mag 7 stocks have been responsible for virtually all the S&P 500’s earnings growth. The other 493 stocks started to close the gap in Q3 of last year. Over the next four quarters, however, Mag 7 EPS growth is expected to reaccelerate slightly from 24.9% to 25.3% while the other 493's earnings growth is expected to decelerate from 11.6% to 6.8%. Q4 earnings season should provide some clarity on whether the S&P 500 will continue to be mega-cap Growth dependent for earnings in 2026. This could also be part of the fluctuations in interest rates as the major money center banks came out with earnings last week and showed that fourth quarter earnings were particularly strong.
This then brings me to what I believe is the ultimate, cumulative manifestation of debt levels, interest rate expense, broad economic growth, and individual company growth. This is the rate of inflation. I bring this up because, President Trump’s push is for lower interest rates. The problem is that first off the Fed has cut rates 6 times in a row- so far, and the economy isn’t just growing, but is growing at a quicker rate. This is also being seen in corporate earnings and the beginning numbers that we are seeing for the fourth quarter support this as well. The head scratcher is that as can be seen below, CPI both year over year and month to month are both declining. This says that inflation is low and staying stable at these lower levels.
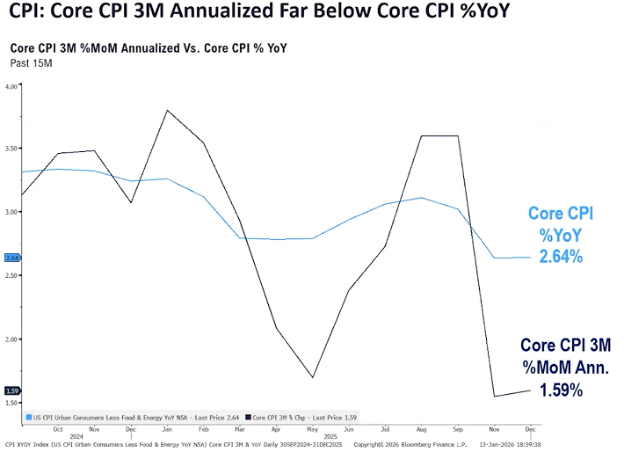
This creates the current quandary. Can the economy continue to grow, earnings continue to grow, and interest rates continue to be cut by the Fed while at the same time continuing the Fed’s inflation mandate of sub-3% inflation? This is a tough one. If this change in interest rates that began last week and showed significant change Monday is any indication, then the Fed cutting interest rates could be a difficult thing to continue.
What does this mean for the general level of the stock market? To answer this, I keep referring back to the chart I’ve shown many times, year after year:
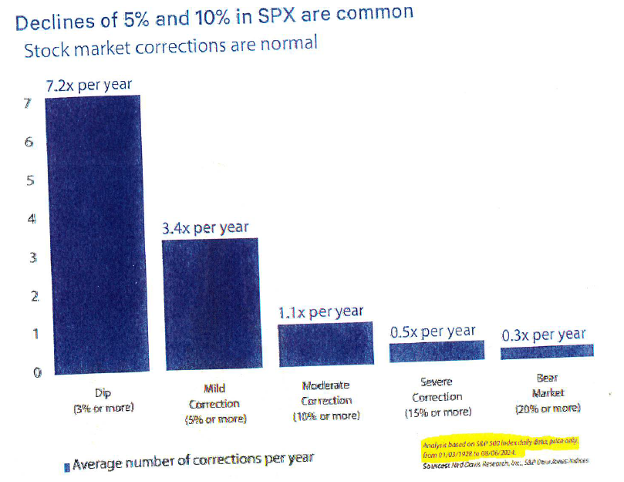
It is very common to have 3%+ dips, also pretty common to 5%+ dips, so the fact that after the action of the markets Monday the S&P is negative for the year, and the tech heavy NASDAQ is actually down almost 3% since September, this could very well be a much-needed pause that refreshes.
I believe that it is a good time to make sure whatever you own is doing as you would expect and put together a list of whatever you would like to take advantage of moving forward should this short-term, media driven fluctuation turn into something more. We will of course remain vigilant in our analysis.
- Ken South, Tower 68 Financial Advisors, Newport Beach
-
Get Ken's Weekly Market Commentary Delivered To Your Inbox!
Important Disclosures:
The opinions voiced in this material are for general information only and are not intended to provide specific advice or recommendations for any individual. To determine which investment(s) may be appropriate for you, consult your financial professional prior to investing. All performance referenced is historical and is no guarantee of future results. All indices are unmanaged and cannot be invested into directly.
All information is believed to be from reliable sources; however LPL Financial makes no representation as to its completeness or accuracy.
Investing involves risks including possible loss of principal.
The Standard & Poor's 500 Index is a capitalization weighted index of 500 stocks designed to measure performance of the broad domestic economy through changes in the aggregate market value of 500 stocks representing all major industries. The S&P 500 is a stock market index tracking the stock performance of 500 of the largest companies listed on stock exchanges in the United States. Indexes are unmanaged and cannot be invested in directly.
The Dow Jones Industrial Average is comprised of 30 stocks that are major factors in their industries and widely held by individuals and institutional investors.
The Nasdaq-100 is a large-cap growth index. It includes 100 of the largest domestic and international non-financial companies listed on the Nasdaq Stock Market based on market capitalization.
The Russell 2000 Index is an unmanaged index generally representative of the 2,000 smallest companies in the Russell 3000 index, which represents approximately 10% of the total market capitalization of the Russell 3000 Index.
Data sourced from Bloomberg (2025).
Stock investing includes risks, including fluctuating prices and loss of principal.
Bonds are subject to market and interest rate risk if sold prior to maturity. Bond values will decline as interest rates rise. Bonds are subject to availability, change in price, call features and credit risk.
Government bonds are guaranteed by the US government as to the timely payment of principal and interest and, if held to maturity, offer a fixed rate of return and fixed principal value.
Bond yields are subject to change. Certain call or special redemption features may exist which could impact yield.
International investing involves special risks such as currency fluctuation and political instability and may not be suitable for all investors.
Alternative investments may not be suitable for all investors and should be considered as an investment for the risk capital portion of the investor’s portfolio. The strategies employed in the management of alternative investments may accelerate the velocity of potential losses.
This information is not intended to be a substitute for specific individualized tax advice. We suggest that you discuss your specific tax issues with a qualified tax advisor.
The economic forecasts set forth in this material may not develop as predicted and there can be no guarantee that strategies promoted will be successful.
LPL Tracking #848366