


I am often asked what I think about …….. and …….. and Trump and…….pick your subject. The best way that I can explain the current environment is to imagine yourself in the front row at a Metallica concert trying to read Paradise Lost by Milton. There are people dancing around and the music is pounding. At the same time, you are trying to focus on something that is super intense. Welcome to investment management today! The media, be it print, radio or almost every television channel, is packed with negative commentary on almost everything whether domestic or foreign. This media is 24/7/365. Unless you are on a desert island with no form of communication it simply can’t be dodged. At the same time the financial markets are a place to concentrate that do not seem to even care about the negatives of the media. I just thought I would start with a little mental visual of what we are dealing with in today’s current environment.
The year’s first half has been defined by uncertainty, ranging from Trump’s unpredictability to the trade war impact on global economic growth, inflation, Fed policy and earnings. And with the fundamental outlook unclear, news-driven shifts in sentiment have fueled the corrections and rallies. If the return of certainty has bullish implications, then the trend improvement would lead to “golden cross” signals on indices, generated by 50-day moving averages crossing above the 200-day moving averages. If the certainty would have bearish implications, then we would be likely to see this “golden cross” reverse. Hence this week’s title. Is this a true breakout and continuation to higher highs or is it going to be a top in market prices?
It’s also quite possible that as with the first half, uncertainty will be the operative description for the year’s second half. In that case, the current rally will stall out and the major benchmarks will fluctuate in ranges for the rest of the year. While surprisingly favorable economic, inflation, and earnings data would support the return of bullish certainty, the opposite would make bearish certainty more likely. But if the fundamental data remains mixed and uncertain, sentiment should continue to dictate the action. Sounds pretty confusing at the moment, doesn’t it?
After a downturn to high neutral levels, sentiment is excessively optimistic again. And that means that as economic and inflation data is reported in the months ahead, the market will be vulnerable if the data fails to meet the expectations. At this point, with it now being July, I find it important to see what normally happens if it is an up market in the first year of a new president in July:
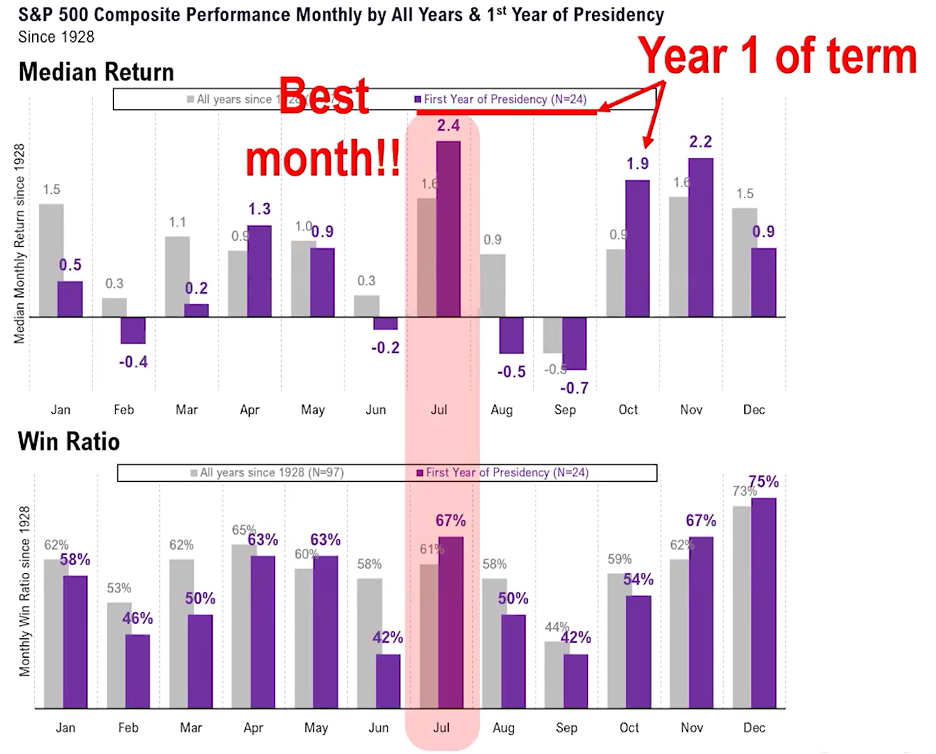
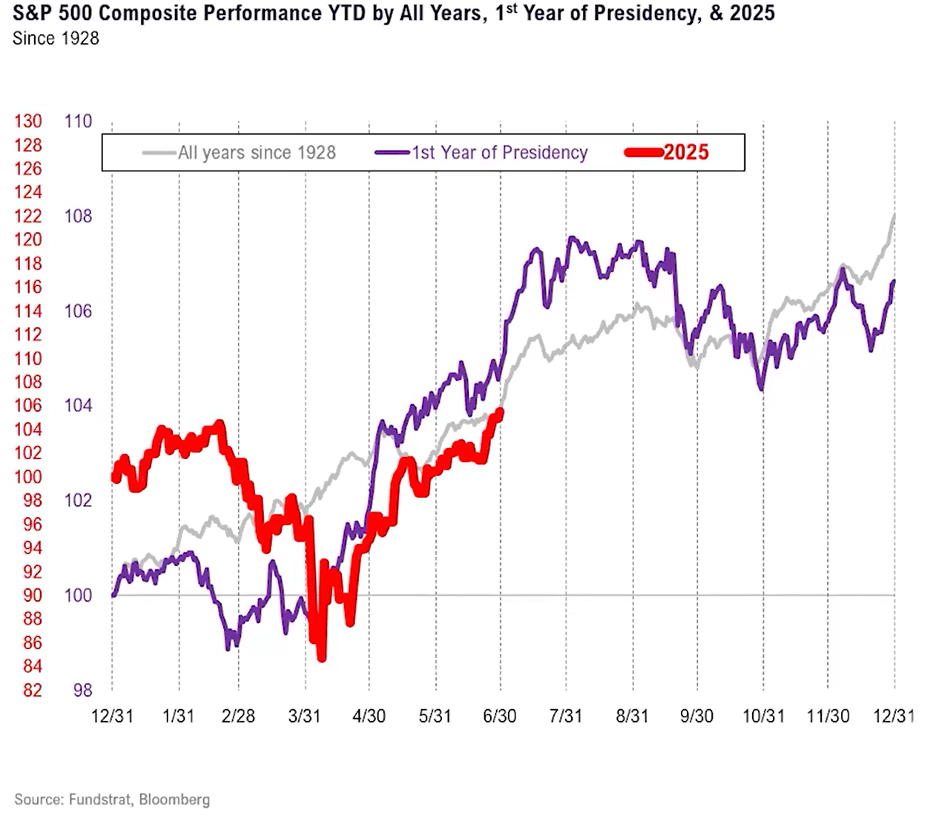
As seen above, historically since 1928, when the market is moving in a positive direction, this is the best month of the year. Since the second quarter was so strong, I have a bit of a problem with this strength continuing but believe that at least a positive month could be in the cards. Taking this one step further, I took a moment to overlay 2025 onto a chart of the average every year since 1928 and every 1st year of presidency since 1928. The move since March has shown strong correlation, and July looks to be quite strong as well. See below:
Big move but pessimism remains
The spike off the April 8 low has been incredible by historical standards. By June 9, the S&P 500 had jumped 20.5% in 42 trading days (two months). Over the last 60 years, we found only six other cases where the S&P 500 jumped more than 20% in two months.
But what may be even more amazing is that many studies on “sentiment” did not end up in the extreme optimism zone, even after such a huge run up. We would have expected very strong readings, like it was in two of the past three cases. Looking at the past should give a clue to the present, but this time was quite different.
This is a bullish set-up because it means there is enough pessimism for the market to keep on rallying. More trade deals, the potential for Fed rate cuts, and the passage of the Big Beautiful Bill are all potential second-half catalysts. So, what I keep asking myself is, who are the remaining bears? Who are these negative nabobs?
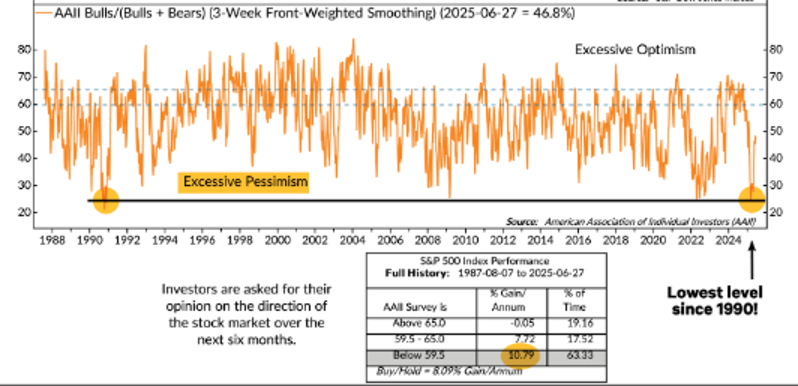
We looked at sentiment surveys from the largest to the smallest investors for clues. And it is the AAII (American Association of Individual Investor) survey that continues to show the least optimism/most pessimism. Based on a quick look at consumer sentiment by political party, we suspect Democrat investors are most likely the remaining bears. This should not come as a shock as the media is almost exclusively democratic by nature and often times highly liberal.
Looking at prior 20%-plus moves in two months for the S&P 500, the Daily Trading Sentiment composite moved above 70, with the pandemic bounce being the exception. That the Sentiment Composite only rose to 62.2 after a 20.5% up price move this year reflects that we started from a very low level of pessimism and that a meaningful amount of pessimism remains. As Ed Clissold of Ned Davis Research pointed out, the Daily Trading Sentiment composite has not been in the excessive optimism zone for more than two days since December 10. This is even with the monster waterfall decline in April.
Individual investors are still not yet Optimistic. The American Association of Individual Investors survey showed only 24.7% bulls by mid-March, the lowest level since the 1990 recession! While the survey showed a sharp rebound in May, less than 50% bulls is still far out of line with other surveys we track. The good news for bulls is that it leaves room for the market to go higher as these bears are converted to bulls. The S&P 500 has returned 10.8% annually when bulls are below 59.5%. See chart below going back 50 years:
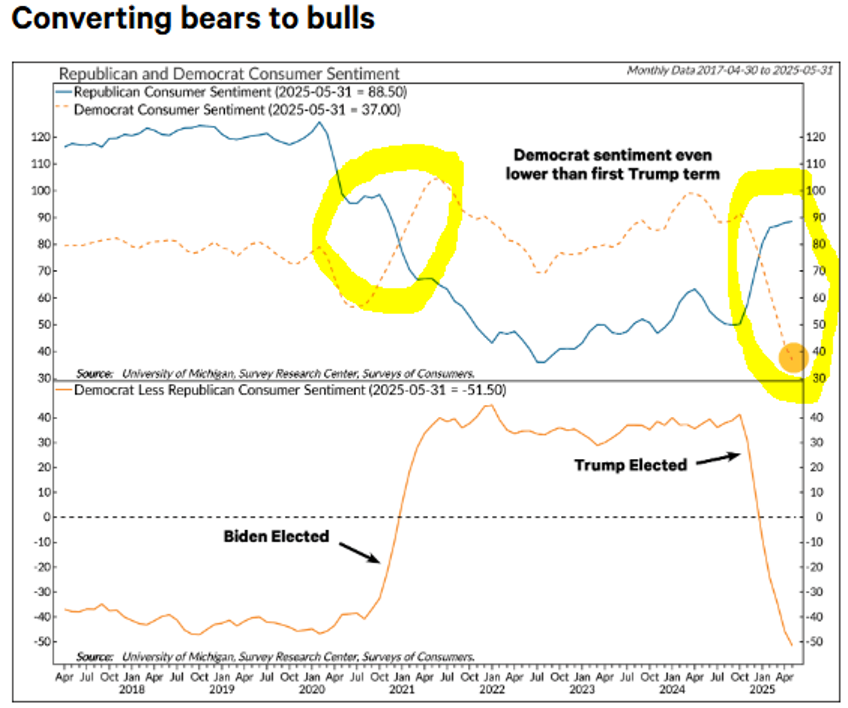
So, if a 24% move in the S&P 500 did not convert most individual investors from bears to bulls, what will? We are starting to believe it may take a new president. Consumer sentiment by political party shows a dramatic plunge in sentiment for Democrats.
The current sentiment reading for Democrats is not only its lowest level since 2017, it is the lowest level relative to Republicans. Whether Republicans remain too optimistic or Democrats too pessimistic is yet to be seen, as there are still plenty of reasons for caution in the second half. However, low levels of sentiment combined with improvement in breadth and bullish price-based model indicators have us thinking that Democrat investor capitulation could fuel the next up-leg of the market. See chart below that shows the sentiment action of the Democrats vs. the Republicans:
Technically, the stock market has also now become more extended and overbought thanks to the latest push up. The S&P 500 is more than 3% above its 20-day EMA, which is a somewhat rare occurrence with only a handful of occasions over the past 2-3 years. Such strength, by itself, is not necessarily bearish, though almost 87% of NYSE operating companies are now above the 10-day moving average and 80% above the 50-day moving average, which is about as "full" as it gets. Often, such overbought extremes at least produce a pause and often a pullback, at least in broader measures. Here is a picture of what the S&P 500 has done with a horizontal line drawn at the high points. You can see upper right that the index broke up and out of this horizontal lid on the markets last week: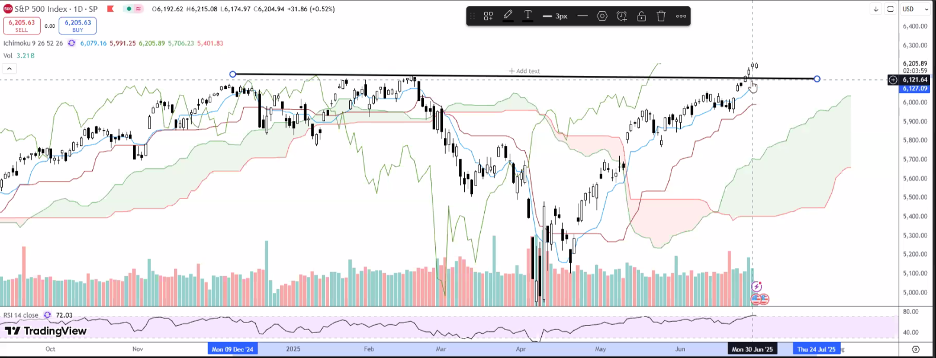
What makes us feel a bit better is that the equal weighted S&P, which gives fewer voting rights to the Magnificent 7 tech giants, also shows a breakout. This is a testament to the broadening out of the leaders.
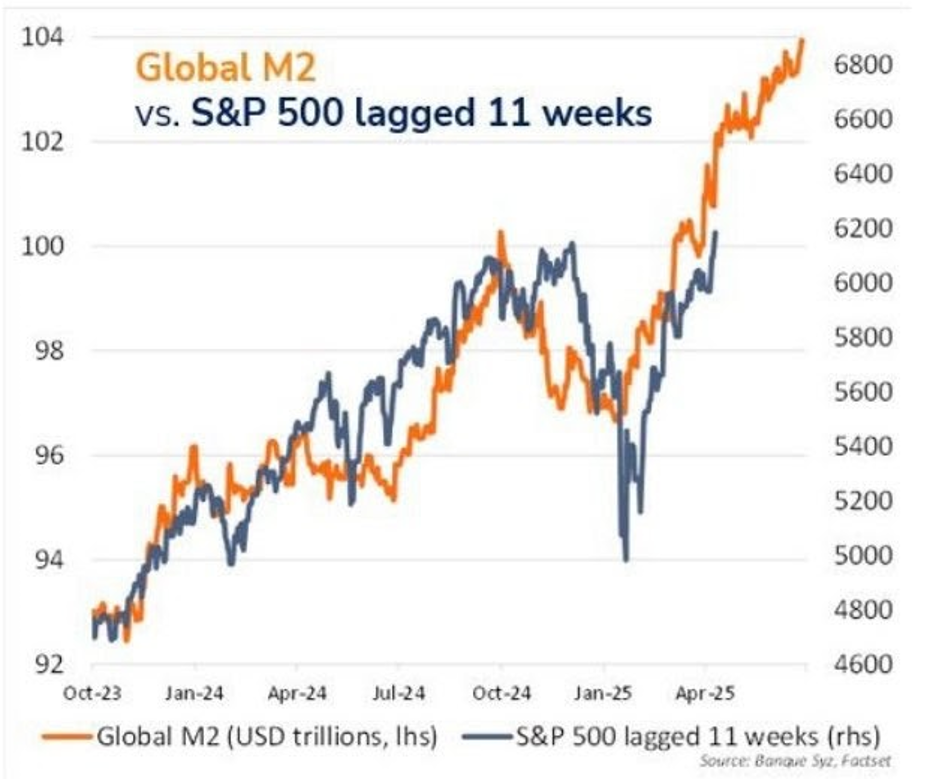
In closing, we can’t help but be happy about the action out of both US and World (ex. US) markets for the first half. Performance has rescued markets from the jaws of a tariff disaster, but will it continue? As can be seen above, if the first half is good and the market is in an uptrend, July tends to continue the move. I realize that these are stats going back to 1928, but I am still quite suspect, and I will be giving much more attention to the earnings that begin this coming week. These earnings reports should give us some color on the true economic effect of Trump’s aggressive policies on tariffs and trade. At the same time, I can’t help but continue to believe that this unrelenting rush of free capital should provide a strong reason for markets to continue higher. Last Friday the folks at Virtue of Selfish Investing provided a chart of M2 Money supply overlayed on a chart of the S&P. It turns out that the S&P has tracked increases in money supply very closely with an 11-month lag. Let’s hope that what this chart telegraphs ends up being the case!
As always, please feel free to reach out with any questions you may have.
- Ken South, Tower 68 Financial Advisors, Newport Beach
-
Get Ken's Weekly Market Commentary Delivered To Your Inbox!
Important Disclosures:
The opinions voiced in this material are for general information only and are not intended to provide specific advice or recommendations for any individual. To determine which investment(s) may be appropriate for you, consult your financial professional prior to investing. All performance referenced is historical and is no guarantee of future results. All indices are unmanaged and cannot be invested into directly.
All information is believed to be from reliable sources; however LPL Financial makes no representation as to its completeness or accuracy.
Investing involves risks including possible loss of principal.
The Standard & Poor's 500 Index is a capitalization weighted index of 500 stocks designed to measure performance of the broad domestic economy through changes in the aggregate market value of 500 stocks representing all major industries. The S&P 500 is a stock market index tracking the stock performance of 500 of the largest companies listed on stock exchanges in the United States. Indexes are unmanaged and cannot be invested in directly.
The Dow Jones Industrial Average is comprised of 30 stocks that are major factors in their industries and widely held by individuals and institutional investors.
The Nasdaq-100 is a large-cap growth index. It includes 100 of the largest domestic and international non-financial companies listed on the Nasdaq Stock Market based on market capitalization.
The Russell 2000 Index is an unmanaged index generally representative of the 2,000 smallest companies in the Russell 3000 index, which represents approximately 10% of the total market capitalization of the Russell 3000 Index.
Data sourced from Bloomberg (2025).
Stock investing includes risks, including fluctuating prices and loss of principal.
Bonds are subject to market and interest rate risk if sold prior to maturity. Bond values will decline as interest rates rise. Bonds are subject to availability, change in price, call features and credit risk.
Government bonds are guaranteed by the US government as to the timely payment of principal and interest and, if held to maturity, offer a fixed rate of return and fixed principal value.
Bond yields are subject to change. Certain call or special redemption features may exist which could impact yield.
International investing involves special risks such as currency fluctuation and political instability and may not be suitable for all investors.
Alternative investments may not be suitable for all investors and should be considered as an investment for the risk capital portion of the investor’s portfolio. The strategies employed in the management of alternative investments may accelerate the velocity of potential losses.
This information is not intended to be a substitute for specific individualized tax advice. We suggest that you discuss your specific tax issues with a qualified tax advisor.