


Post COVID inflation surge
Global inflation soared to new heights in the early 2020s. Clearly the result of global “helicopter delivery” of money due to total shutdown. The COVID reopening, which came with excess pandemic-related savings and supply chain snarls, caused immense demand and supply shocks that saw inflation soar all over the world. Russia’s invasion of Ukraine in 2022 put further pressure on energy costs (especially among the economies that are less energy independent) and some food prices, prolonging the inflationary saga. Indeed, the global inflation rate peaked at nearly 11% in late 2022, the highest since 1988. Back down again Since then, we’ve seen global inflation cool significantly, now growing at less than half that peak pace. Sharp slowdowns in global inflation like we’ve seen in recent years have likely been associated with and was the backbone of strong global equity market performance.
Economy-specific trends Contrary to the pandemic reopening, which saw worldwide causes of higher inflation, the paths are now more economically specific. At this point, most of the world’s major economies have reported CPI data for July. We review these latest inflation figures among these economies and assess how it may impact the policies of their respective central banks. The U.S. and the U.K. are still seeing above-target inflation, keeping central bank rates above their neutral levels. The eurozone and Canada have seen inflation around their targets, but they’re not completely out of the woods yet. Japan appears to be finally getting out of its multi-decade deflationary trap, while China could be in the early stages of entering one. India has seen inflation cool meaningfully, which has allowed the RBI to ease policy, while Brazil’s inflation remains uncomfortably high.
U.S. inflation picking up CPI was steady at 2.7% from a year earlier in July, but the core rate picked up to 3.1%, a five month high, amid some tariff passthrough and sticky services inflation. Core goods prices, which had previously been deflationary, jumped 1.2% from a year earlier, the most in over two years. Excluding the pandemic, this was the fastest pace of core goods inflation since June 2012. Part of it was due to an unfavorable base effect. Even so, the increase in core goods inflation also shows an initial impact from tariffs. The tariff impact on goods is clear in the manufacturing PMI data, as the manufacturing output price index rose to its highest level in three years. Comparatively, price pressures in other parts of the world are far more muted than in the U.S., indicating the profound impact of tariffs.
Super-core inflation accelerated to 3.3%, a five-month high. It consists mostly of labor-intensive services and tends to be sticky. With labor supply squeezed by ICE raids and deportations, elevated labor costs in some industries are likely to keep upward pressure on super-core inflation. Shelter inflation eased slightly to 3.9% and could ease further as the housing market softens but is still running hotter than pre-pandemic. We expect inflation to firm up in the months ahead. But with the labor market on a shakier ground, and long-run inflation expectations still broadly anchored, we currently expect the Fed to cut rates in September. Not because we think this is the right decision, given a still healthy economy. But higher price pressures may limit the degree of rate cuts and its ability to go back to a neutral rate.
U.S. Q2 real GDP growth revised up, highlighting the economy’s resilience
Q2 real GDP growth was revised up to a stronger-than-expected 3.3% annualized rate from 3.0% in the initial estimate. It followed a 0.5% annualized decline in Q1, amounting to 1.4% average growth in 1H 2025, which is half the growth pace in the second half of 2024. The moderation in trend growth has come amid economic policy upheaval, including tariffs, deportations, tax cuts, etc., which has manifested in record high policy uncertainty in Q2. The uncertainty has now subsided, although to a still-elevated level by historical standards. We expect the economy to continue to expand at a moderate pace in 2H 2025, with real GDP gaining 1.0%-1.5% for the full year. The strong rebound in Q2 growth was mostly due to a sharp decline in imports, a reversal of the prior quarter’s jump ahead of anticipated tariffs. The upward revision, however, reflected stronger consumer spending and capex than previously estimated, which were only partly offset by weaker government spending and deeper inventory cuts.
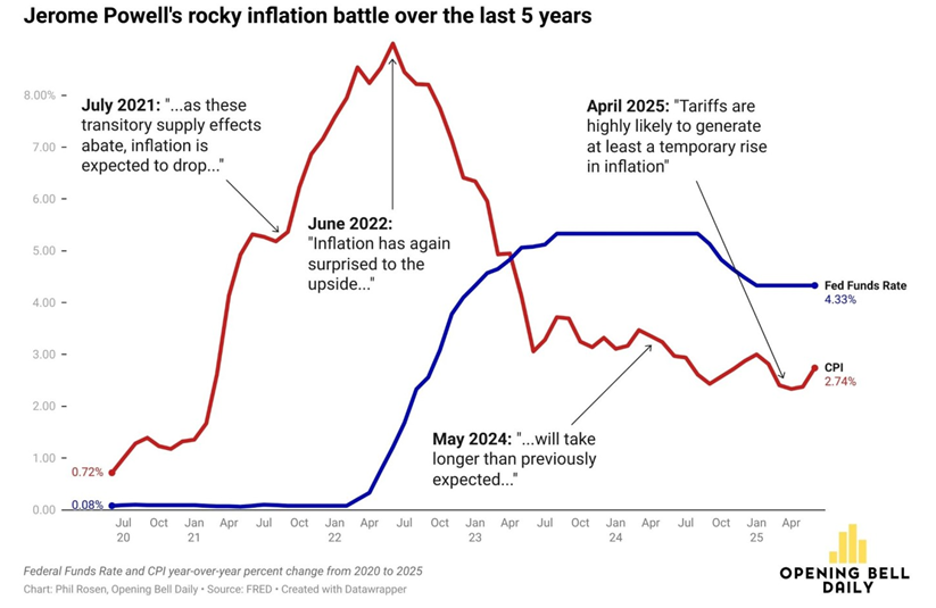
So is Fed Chair Powell telegraphing the correct message?
Many are surprised by the comments from Fed Chair Powell at Jackson Hole a couple of Fridays ago. Should we be? I don’t think so. Although he is disciplined by a data dependent approach, he is at the same time inherently late in the actions he takes. This by virtue of the magnitude of the US Economy and the immense size and effort necessary to turn this battleship in a bathtub, it is doomed to cost the economy a tremendous amount in money, jobs and ultimately human life. Could it be better? Of course, but this would require a never wrong crystal ball.
Powell was dead wrong when he said he expected inflation to drop in July 2021 after an unprecedented amount of quantitative easing that began in March 2020 due to Covid. Then he was actually surprised in June 2022 when inflation kept coming in hot. Meanwhile, we had advised members as early as November 2021 that the Fed had changed their tune about QE so tightening lay ahead.
Two narratives clash over a rate cut, each with different takes on recent economic data. On one side, the bulls see enough signals flashing red: GDP crawling forward at just 1.2%, consumer spending losing momentum, payroll growth stalled. To them, the 4.2% unemployment rate masks real fragility. With core inflation dropping toward 2.5%, they argue the Fed is now running the risk of breaking the labor market further and locking housing affordability into crisis mode. These advocates want an immediate move, arguing it will give equities and housing some relief, with room to step back if inflation rears up again.
The bears, meanwhile, aren’t buying it. They warn any easing could spark a rebound in inflation, pointing to July’s jump in producer prices and sticky services costs. While job growth appears limp, they say the labor market still looks robust by historical standards, and slower growth isn’t synonymous with weakness. Instead, they highlight structural risks the Fed can’t ignore: persistent fiscal deficits, inflated asset prices, and questionable valuations. For them, higher rates are the anchor against instability. Cut rates too soon, and they see a replay of past mistakes: stoking bubbles, undermining credibility, and risking another bout of runaway inflation.
One key metric favors the bulls: global liquidity. With US and China pumping QE into the ecosystem, markets should continue to head higher overall with the occasional 3 steps forward, 2 steps back. For example, after Trump shocked markets in early April with far steeper tariff proposals, markets mini-crashed but then quickly shot to new highs over the ensuing weeks. Global liquidity played the major role.
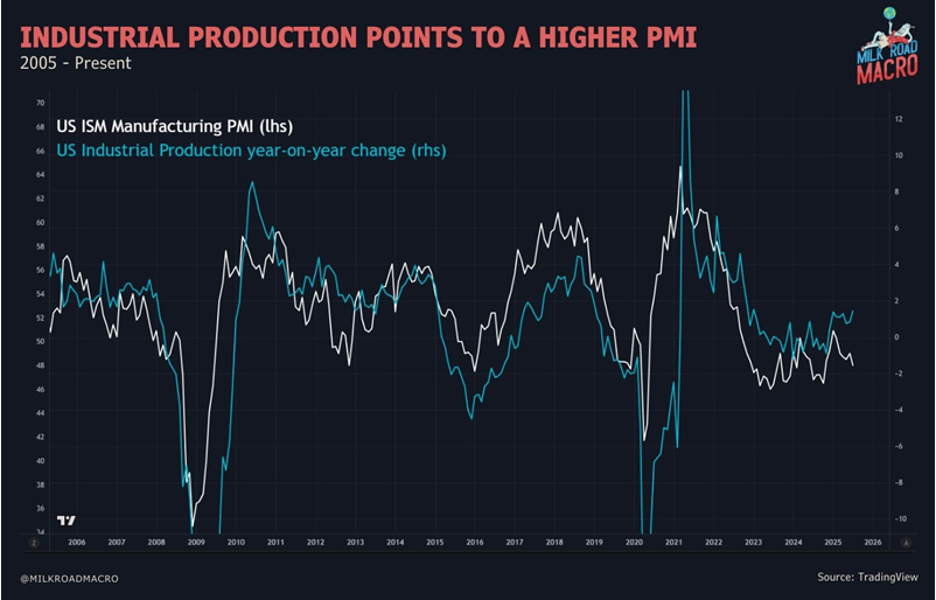
Global liquidity
Financial Conditions Index measures M2 money supply, central bank operations, bond yields, commodity prices, and institutional capital flows which indirectly measures the global liquidity. It is currently showing loose conditions. It correlates well with the S&P 500 and Bitcoin. The ISM Manufacturing PMI (Purchasing Managers Index) does not show the cleaner cycles that we have seen in previous years, making it difficult to assess exactly where we are in the business cycle. This continued in its most recent print with a disappointing 48 meaning the manufacturing sector is still in “contraction” since it is below 50. But regional fed manufacturing surveys and industrial production both suggest a higher ISM ahead.
In closing, we are sort of in a flat spot in news and corporate earnings. After the big earnings and lackluster action out of the semiconductor behemoth, Nvidia last week, other than some economic indicators being reported, we are in sort of an information flat spot. This is why this week I wanted to give a short synopsis of what is going on economically to give a true backdrop of what is to happen next.
As it sits, we are in sort of a Goldilocks period for the economy, and earnings. Yet, where are the markets going next? We are at new highs, breaking above long-term trends going back to the early 1900’s, yet valuations are in question. I believe we need more information before a change in current trends can be seen. At present, stay the course. Moderately firm US Dollar, rates in a stable range going back a number of years, and equity markets reflecting good earnings growth.
- Ken South, Tower 68 Financial Advisors, Newport Beach
-
Get Ken's Weekly Market Commentary Delivered To Your Inbox!
Important Disclosures:
The opinions voiced in this material are for general information only and are not intended to provide specific advice or recommendations for any individual. To determine which investment(s) may be appropriate for you, consult your financial professional prior to investing. All performance referenced is historical and is no guarantee of future results. All indices are unmanaged and cannot be invested into directly.
All information is believed to be from reliable sources; however LPL Financial makes no representation as to its completeness or accuracy.
Investing involves risks including possible loss of principal.
The Standard & Poor's 500 Index is a capitalization weighted index of 500 stocks designed to measure performance of the broad domestic economy through changes in the aggregate market value of 500 stocks representing all major industries. The S&P 500 is a stock market index tracking the stock performance of 500 of the largest companies listed on stock exchanges in the United States. Indexes are unmanaged and cannot be invested in directly.
The Dow Jones Industrial Average is comprised of 30 stocks that are major factors in their industries and widely held by individuals and institutional investors.
The Nasdaq-100 is a large-cap growth index. It includes 100 of the largest domestic and international non-financial companies listed on the Nasdaq Stock Market based on market capitalization.
The Russell 2000 Index is an unmanaged index generally representative of the 2,000 smallest companies in the Russell 3000 index, which represents approximately 10% of the total market capitalization of the Russell 3000 Index.
Data sourced from Bloomberg (2025).
Stock investing includes risks, including fluctuating prices and loss of principal.
Bonds are subject to market and interest rate risk if sold prior to maturity. Bond values will decline as interest rates rise. Bonds are subject to availability, change in price, call features and credit risk.
Government bonds are guaranteed by the US government as to the timely payment of principal and interest and, if held to maturity, offer a fixed rate of return and fixed principal value.
Bond yields are subject to change. Certain call or special redemption features may exist which could impact yield.
International investing involves special risks such as currency fluctuation and political instability and may not be suitable for all investors.
Alternative investments may not be suitable for all investors and should be considered as an investment for the risk capital portion of the investor’s portfolio. The strategies employed in the management of alternative investments may accelerate the velocity of potential losses.
This information is not intended to be a substitute for specific individualized tax advice. We suggest that you discuss your specific tax issues with a qualified tax advisor.
LPL Tracking #788282