


Should I stay, or should I go now?
If I go, there will be trouble
And if I stay, it will be double
So come on and let me know
Should I stay or should I go?
The market performance over the rest of the year could be a preview of what to expect next year. If the year-end rally attempt includes resurgent breadth (more companies joining the charge higher), it would be reassurance that the bull market is well intact. The companies that really need to represent this spreading of the advance in the US is the participation in the Small-Cap Index, Russell 2000. As can be seen below, it seems to have gone through its digestion and might be starting a continuation leg higher:
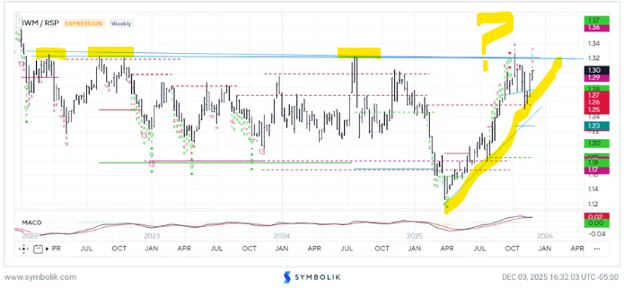
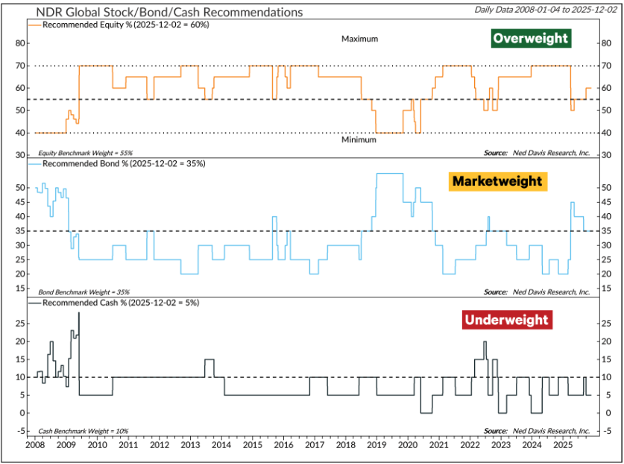
If it remains sluggish (as it was during October and November), it could warn of difficulties in 2026. The stock markets of the world November-December return has usually been the best of all two-month periods, gaining a median of 3.75% over the two-month period. Currently flat for the period thus far, the all-world index has some work to do if it’s going to live up to the historical record. According to Ned Davis Research, the advance in equities continues across the globe and this is how they are seeing an investor should focus their allocation based on current action:
What’s missing is bullish breadth.
While there’s been improvement during the recovery from the November lows, it has been far from enough to indicate that a broad year-end rally is underway. According to Ned Davis Research, only three of the 16 indicators are at levels consistent with sustained rallying, with the aggregate maintaining a series of lower highs since the summer. A similar pattern developed in last year’s fourth quarter, which also lacked a broad year-end rally. The Rally Watch aggregate reached a series of lower highs, culminating in the stiff global decline from February to April. I find this interesting as this dovetailed with the expectation that I kept bringing up about the 4-year presidential cycle and how the first year of almost every president going back in time has had a difficult period. In the 2024 case Ned Davis’s research saw it coming, based on their analysis and this dovetailed with historical market rhymes. This is why I pay so much attention to historical cycle work on top of very current analysis. The short run, according to the last two weeks, shows a convincing, albeit rather short period. Note the action I shared last week with the action from this week. Clearly the action of the S&P is showing a different pattern:
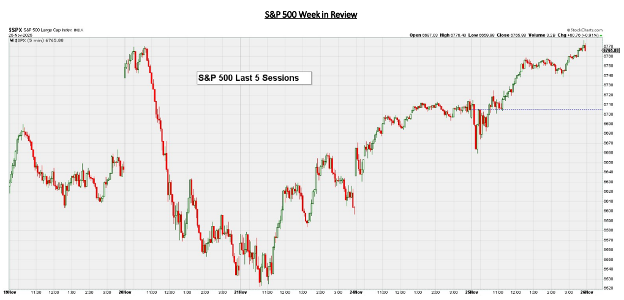
Now, this past week:
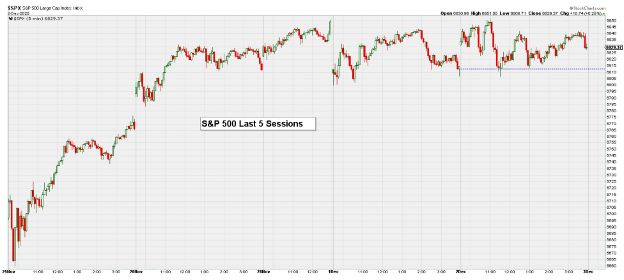
It is clear that after the final flush at the end of November, the market has been on the positive side of the ledger.
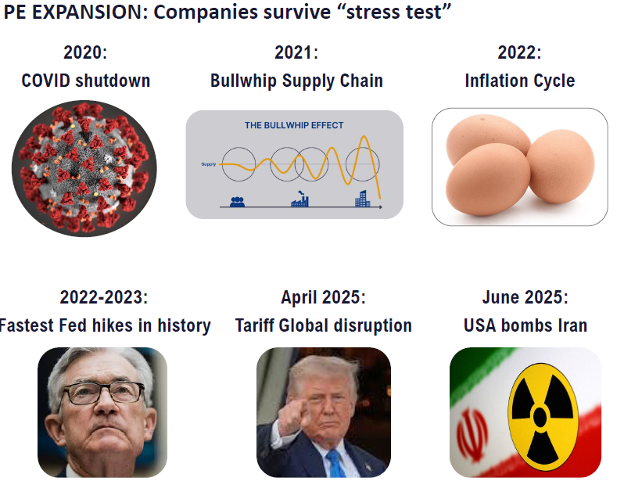
The Ned Davis aggregate study also diverged way back in 2021, again lacking a strong year-end rally. A bear market started in the following January, ending in October 2022. That time it was attributed to the multiple interest rate hikes by the Fed, but again, these aggregate measures precipitated the move. The “reason” for the move “this time” was clearly the Fed and them sucking the oxygen out of the room by spiking the interest rates. But in contrast to 2021 and 2024, 2022 ended with a broad rally that sent the ACWI up by 7% from the October low. Similarly, the aggregate number of signals diverged from July to October of 2023, accompanied by that year’s correction. By November, however, the correction was over. And what followed was a November-December rally of 12%. The aggregate rose sharply, exceeding the 50% threshold by December. That led a gain of 24% over the next year. The reason I bring this up in such a granular fashion was that we seem to be experiencing exactly the opposite reasons this time. Here is the progression so the previous discussion is easier to follow:
- COVID hits and massive liquidity helicopter dropped on global economies.
- Massive liquidity caused copious consumption by the normal consumers but also those that were on the periphery as they got a slug of free money.
- Inflation ensued and therefore the Fed spiked interest rates to squash the feared inflation.
- The Fed stopped raising rates and the manufacturing continued and consumption continued, this time catalyzed by AI and other technological enhancements.
- Market has been on a run yet hit a couple of speed bumps this year due to new policies from a very different political regime.
- Now, the most hated V-shaped recovery seen in longer than I can recall.
Here are a couple graphics of these events. Note the first one is the events. The second one being the overlay with the V-shaped recovery of the markets:
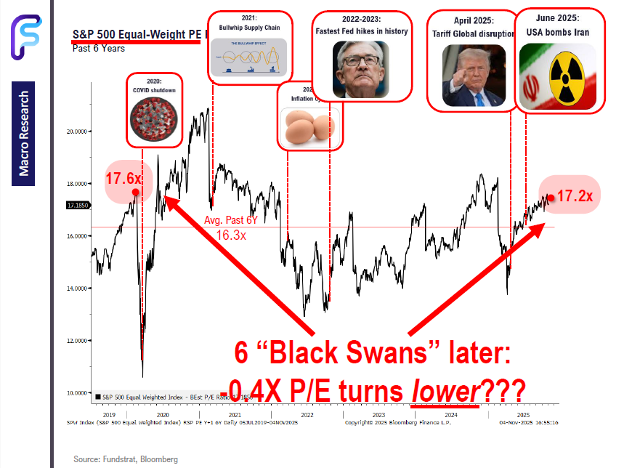
The reason why I sort of dragging you into the weeds on this issue is that I feel that you MUST differentiate between the “reason de jour” this time and the “facts” as they are being presented by empirical data. This is one of the most important factors that I can share with you. Most investment programs at major money center banks are all based on historical data. I think this should be respected, but altered, as every time is a bit different. If we are paying attention, applying historical rhymes/ consistencies and then seeing what the data is saying, we should be able to be better.
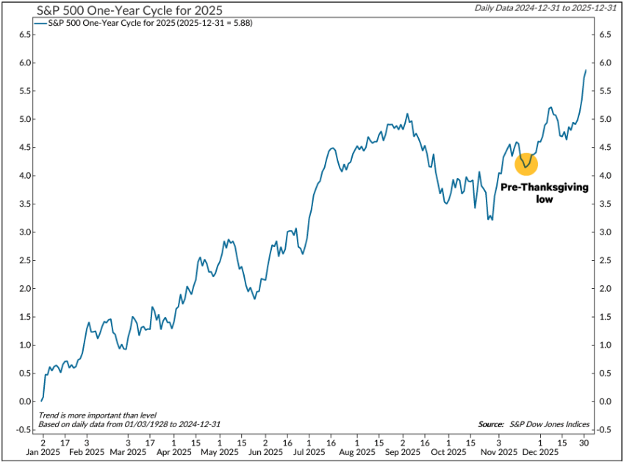
The implication is that the aggregate’s current downtrend could be bad news for the market if it doesn’t give way to enough broadening to break the downtrend. If instead we see bullish levels reached by a growing contingent of the report’s breadth thrust and longer-term breadth indicators, a good start to 2026 could be likely. Here is the cycle study that shows how this has tended to play out. Note where we are in this progression:
Perhaps this is the expectation based on the assumption that the AI-influenced mega-caps (Magnificent 7) will keep pulling the benchmarks higher. This has been a major point of contention by market prognosticators since the move in the markets have been concentrated in a very few names. This is also partially the reason for this being the “most hated V-shaped recovery.” The reality is that this is how it has always happened! As there are global changes; the telephone, the steam engine, the internet, medicine the markets become concentrated in these industry leaders. How long? Until it ends!
Equities will be challenged by the 4-year presidential cycle that moves from positive to negative as the second year gets started, with global uncertainties persisting into 2026. Along with the Fed chairman and mid-term election unknowns in a U.S. market that accounts for nearly two thirds of global market cap, the full impact of the tariffs has yet to be known. In the U.S. and globally, affordability concerns are at the forefront and stagflation remains a significant risk. The bottom line, however, is that current conditions warrant overweight equity allocation, as indicated by the November cyclical data, and the bounce referenced in last week’s newsletter. We expect to get more positive & confident if a year-end rally produces breadth thrust signals. If not, with increasing evidence that the market is failing to meet the challenges, we won’t waste time cutting exposure if the equity reading starts to decline.
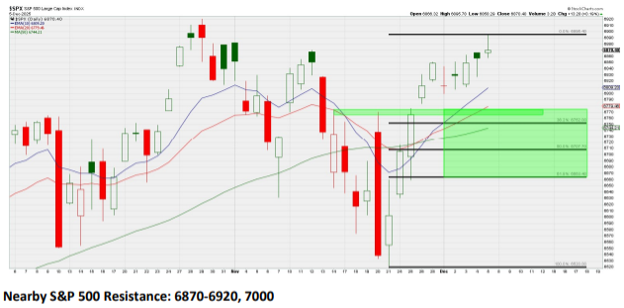
Fast forward to today. S&P 500 Consolidating After Breaking Above ~6775 Resistance The stock market had a strong response after failing to break down under 6550 in definitive fashion. This illustrates once again that failures around key levels can produce sharp moves in the opposite direction. With the break and hold above clear resistance around 6775, the odds have risen that the recent low “sticks” (refer to last week and previous week pictures above). In ideal technical fashion, the S&P should now continue to hold above that ~6775 region, but I am willing to give it a little more wiggle room. There really isn’t a good reason to drop back below 6725 since that would take the index back below several key moving averages, but even a retracement to around 6650 would technically still be within the realm of normal. The bottom line is that as long as dips remain mild like this, I’m expecting an eventual follow-through higher. Here is the picture as of Friday’s close:
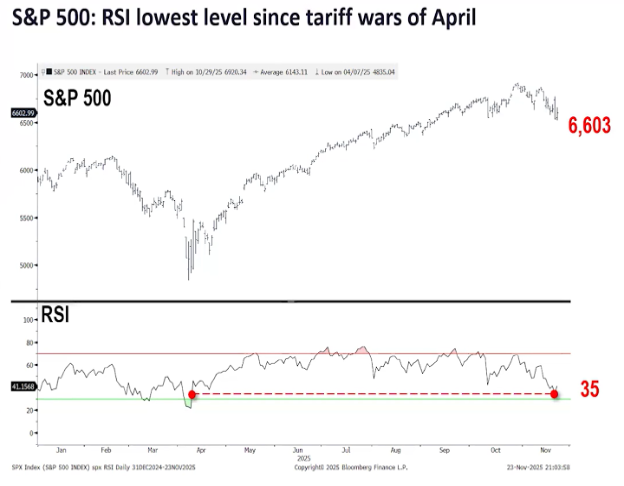
The Federal Reserve’s policy decision this afternoon will be the center of the week, and any guidance they provide with respect to the future path of rates could cause the market to swing. This is how the Relative Strength Index is currently sitting. Note that it is almost as low as it ultimately was in the April market low. This could also provide a good backdrop for the year-end rally:
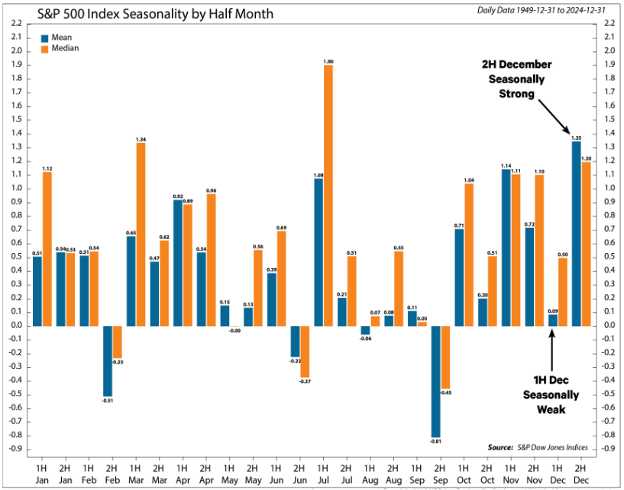
This is the seasonality study going back to 1949. If you look at the far right, the first half of December has historically been tough, and this has been followed by very seasonally strong second half of the month:
In closing, Thomas Lee of FundStrat has put together six reasons for a December rally, and hence a strong setup for year-end.
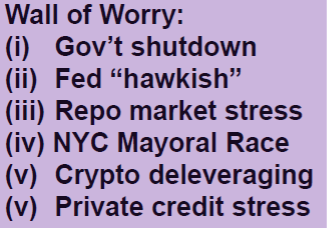
- The Government shutdown is over and as we reflect, it really was a bunch of saber rattling between parties as is the norm
- The Fed’s Hawkish (tight money to curb inflation) stance has relented and should be followed by less interest expense stress, hence the term, “Never Fight The Fed.
- Repo market is the market that the Fed uses to inject money into the economy. It has moved to a stance of liquidity rather than restriction.
- Mayoral race in New York was a big juicy steak for the media to scare everyone with. What the media failed to illustrate was that many of the Socialist initiatives of the new mayor will be impossible to accomplish without the sponsorship of much larger Government entities.
- Crypto currencies, which have been the bastion of speculation in the financial markets sort of had their “comeuppance” moment, and yet the rest of the markets were unphased.
- The Jamie Dimon Cockroach theory has not seemed to find too many more nasty roaches and therefore diminished fear in the credit markets.

So, this leaves us with the final December seasonality. December historically finishes strong, especially after a pullback:
ADDENDUM: IF YOU ARE A G-MAIL USER, YOU SHOULD READ THIS:
Google now allows AI to scan your entire Gmail inbox — every email, every attachment, personal, corporate, financial, etc. Nothing that passes through your account goes unscanned.
Want to turn it off? Here is a step-by-step on how to deactivate these settings.
- Login to your Gmail account.
- Go to the Settings gear.

- Once the menu opens, you click “See All Settings”.

- Once you click that, the screen will populate a new list of settings. You will need to scroll down the page until you see “Smart Features”.

- You will uncheck the box next to the bolded phrase “Turn on smart features in Gmail, Chat and Meet”. Once you uncheck the box, you will be prompted with a popup, where you will click “Turn Off and Reload”.

- Once that step is completed. The Settings section will close.
- Go back to the Settings gear, like in Step #2.
- Repeat Step #3.
- Once you are in the Settings menu, you will scroll through the list of settings until you see “Google Workspace Smart Features”

- Once you click into the “Google Workspace Smart Features” section, you will receive a pop-up on your screen. You will need to toggle off both check marks and click “Save”.
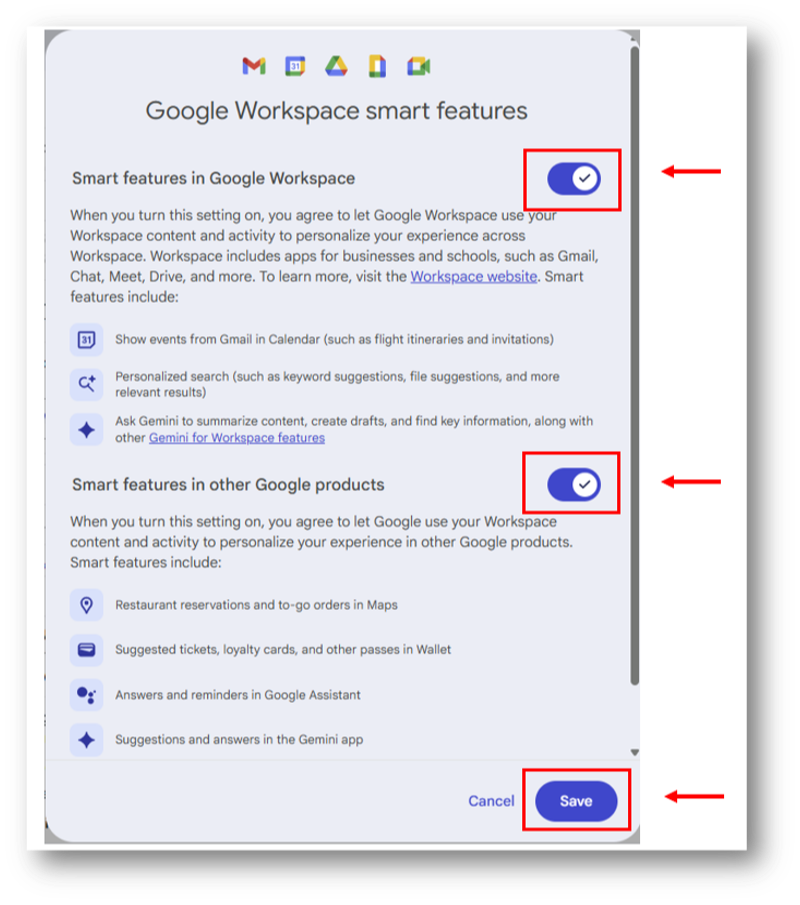
- Once you click “Save” after toggling off the two settings, you are all set!


- Ken South, Tower 68 Financial Advisors, Newport Beach
-
Get Ken's Weekly Market Commentary Delivered To Your Inbox!
Important Disclosures:
The opinions voiced in this material are for general information only and are not intended to provide specific advice or recommendations for any individual. To determine which investment(s) may be appropriate for you, consult your financial professional prior to investing. All performance referenced is historical and is no guarantee of future results. All indices are unmanaged and cannot be invested into directly.
All information is believed to be from reliable sources; however LPL Financial makes no representation as to its completeness or accuracy.
Investing involves risks including possible loss of principal.
The Standard & Poor's 500 Index is a capitalization weighted index of 500 stocks designed to measure performance of the broad domestic economy through changes in the aggregate market value of 500 stocks representing all major industries. The S&P 500 is a stock market index tracking the stock performance of 500 of the largest companies listed on stock exchanges in the United States. Indexes are unmanaged and cannot be invested in directly.
The Dow Jones Industrial Average is comprised of 30 stocks that are major factors in their industries and widely held by individuals and institutional investors.
The Nasdaq-100 is a large-cap growth index. It includes 100 of the largest domestic and international non-financial companies listed on the Nasdaq Stock Market based on market capitalization.
The Russell 2000 Index is an unmanaged index generally representative of the 2,000 smallest companies in the Russell 3000 index, which represents approximately 10% of the total market capitalization of the Russell 3000 Index.
Data sourced from Bloomberg (2025).
Stock investing includes risks, including fluctuating prices and loss of principal.
Bonds are subject to market and interest rate risk if sold prior to maturity. Bond values will decline as interest rates rise. Bonds are subject to availability, change in price, call features and credit risk.
Government bonds are guaranteed by the US government as to the timely payment of principal and interest and, if held to maturity, offer a fixed rate of return and fixed principal value.
Bond yields are subject to change. Certain call or special redemption features may exist which could impact yield.
International investing involves special risks such as currency fluctuation and political instability and may not be suitable for all investors.
Alternative investments may not be suitable for all investors and should be considered as an investment for the risk capital portion of the investor’s portfolio. The strategies employed in the management of alternative investments may accelerate the velocity of potential losses.
This information is not intended to be a substitute for specific individualized tax advice. We suggest that you discuss your specific tax issues with a qualified tax advisor.
The economic forecasts set forth in this material may not develop as predicted and there can be no guarantee that strategies promoted will be successful.
LPL Tracking # 835053