


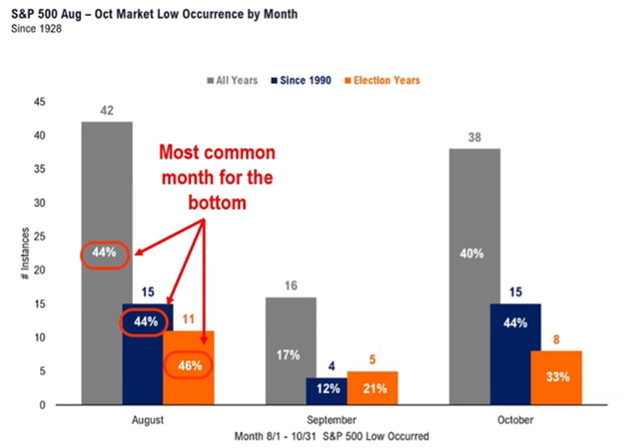
Last week I titled my note, "Mama Said There Would Be Days Like This." As has been the norm of the equity markets of late, there have been days rather than months or even years. Still, those who are inquisitive (including myself) often then ask the question, "What Happened?" One will never know for certain what the supposed catalysts were for a market correction, or advance for that matter, but I believe there is a very high probability that a combination of actions at the same time or in close succession could quite possibly be the combination of straws that broke the proverbial camel's back. Before I go into these, I think it's safe to say that excluding the brief blip of late April and May, the equity market, as viewed as the S&P 500, has been in a very tight advancing range since the beginning of October last year. Equity markets tend to a pullback of some consequence have two to three times a year. I asked the simple question as to whether August is a month that tends to harbor weakness more than other months and also, given that this correction has logged around a 10% decline from the highs, how often does this occur. So here are the answers to those two questions. The first chart below confirms that August tends to be the month of the year that is most common for a correction:
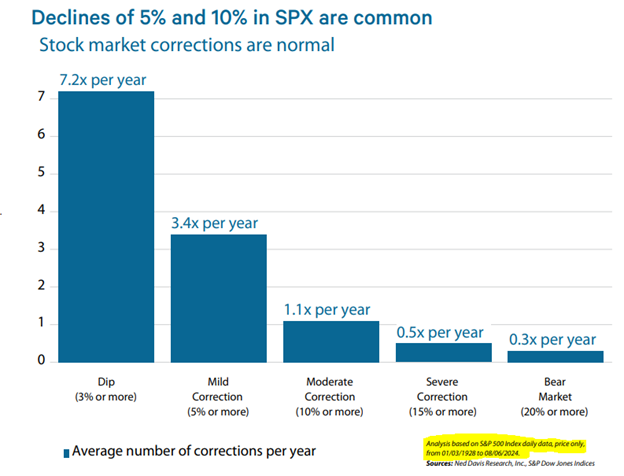
The next statistic that few tend to pay much attention to is that markets tend to have very few "bear markets" (20% down or more) or even severe corrections (15% or more down). Yet, they do seem to, annually, put in a series of pullbacks with great consistency. The 10% variety, which we just experienced, tends to be once a year sort of flu and more mild dips occur more often. Just remember, we are flying the plane to a great vacation. There will be some turbulence, and you might spill a bit of your coffee (or maybe something a bit stronger), but you will get to your destination and enjoy yourself.
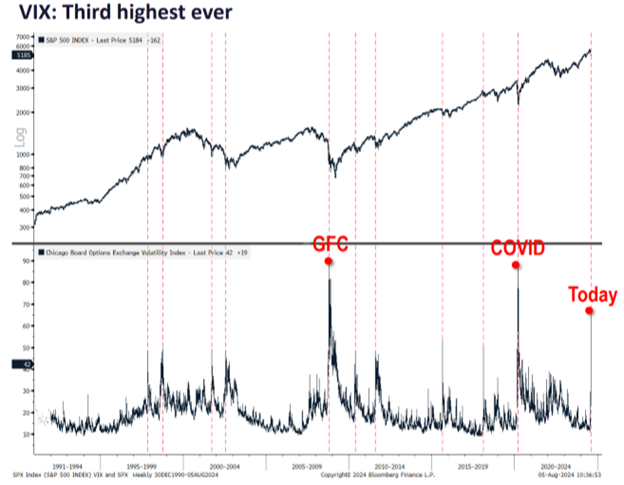
The next question that I asked myself was how do markets act after two days back-to-back of significant decline. And how bad was this down move of Friday and Monday combined. As can be seen below, the veracity of this decline, as measured by the VIX (the volatility index) has only been preceded by higher levels of volatility two times EVER! And these two times were clearly more disastrous situations than the Japanese raising their interest rates a meager 1/4%. Given that this was clearly not a reason of magnitude that is commensurate with the two previous VIX spikes, it tends to tell me that this was a shaking of the loose leaves off the tree and that after a bit of stabilization things should be back on course, barring any other global events.
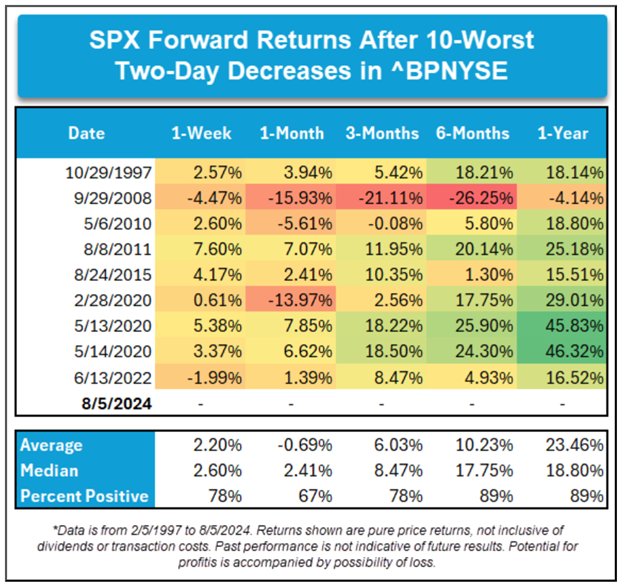
So, after two days of extreme volatility did it make sense to run and hide out on the sidelines or did it make more sense to analyze what market leaders did and position for the next advance (I will go into this at the end of this report)? In looking at the table presented by Ari Wald of Oppenheimer, it is clear that after only 3 months but definitely after a year, sticking with good leaders was clearly the best choice. In fact, 89% of the time, both 6 months and 1 year later the market tended to be up and up quite big.
Now that I have quantified the depth of the decline as measured by both percentage decline and VIX spike intensity, I think it makes sense to take a moment and cover what has happened in succession and why this decline seemed to have a lot greater of a move than would have been expected.
- Market had gotten tired and run out of juice: earnings reports have been strong, and guidance has been higher than expected since Q4 of 2023. It is true that the majority of companies are still declaring higher earnings than have been expected by analysts, but being that this is the sleepier third quarter coming up next and we are staring into the face of a presidential election that is pretty tough to handicap given a lack of knowledge of the newest candidate entering the picture, markets had already begun to show a flattening and many sectors breaking down.
- Joe Biden stepping down and Kamala Harris stepping up: the markets were pretty confident in being able to handicap both Joe Biden and Donald Trump, as they have both been in office in recent history and therefore odds makers were fairly confident about who was expected to get elected as well as probability of the outcome. So on July 15th when the current president dropped out and his vice president stepped up, all bets were off and the very high probability of a Donald Trump reelection was reevaluated. As everyone knows, the thing that equity markets like the least is what they don't know, and this was clearly a new unknown.
- Labor softness on the Friday: on the Friday decline the news of the morning was that economists were expecting 175,000 new jobs being created, but there were only 114,000. OK, I get it that this was lower than expected. but not negative. I bring up this point as there is a consistency in our Fed decreasing interest rates out of fear of recession when job creation goes negative where this one was only "less strong" but hardly negative. All the same, it did imply that possibly the Fed has waited too long before starting to ease. This was confirmed by a greater than expected decline in interest rates- of all maturities- and therefore fear had another reason to creep further into the stock market.
- The Japanese Carry-Trade Blowup: seemingly all at once investors seemed to bail out of ALL RISK ASSETS. This seemed to be a global excuse to sell virtually everything. The Carry Trade was a function of investors borrowing money in Japan at negative or zero interest cost, and then investing in US Treasuries for zero credit risk and a 5% income or US stocks which have been very strong since the 2022 lows (these are examples, as the true location cannot be know with certainty). To answer the question as to how much money this truly represented, it is tough to answer as there are no official estimates for how much money is tied up in these trades. According to Global Data TS Lombard, there was some $1.1 Trillion piled into the strategy. JP Morgan reported that 75% of this was unwound. In looking at all asset classes this number seems pretty accurate as bonds dropped in price, Bit Coin cratered in price and equities of all sorts swooned. Clearly it was a mass exodus, bordering on a flash crash.
- Brian Wesbury's Liquidity Drain: as I had mentioned last week, all the excess capital that has been sloshing around finally started to dry up and in doing so removed a lot of the firepower that could be used to catch the price of all these asset classes when they were falling.
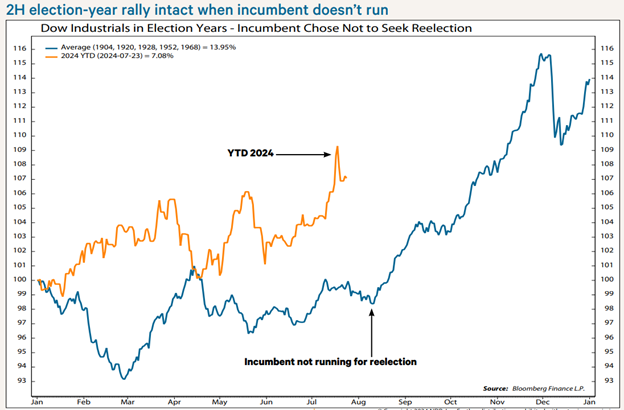
So, the next logical question is where does this leave markets and investors. To answer this, I tried to say that ignoring the above 5 points and looking purely at where we are in the election process, and taking into account that the incumbent isn't running, what tends to happen and where are we in this expected outcome? Going all the way back to 1904, there are a few examples to consider. In the average case, Mid-August tends to be the end of the summertime swoon and then a pretty aggressive rally into year-end tends to occur. See this in the chart below compliments of NDR Research team:
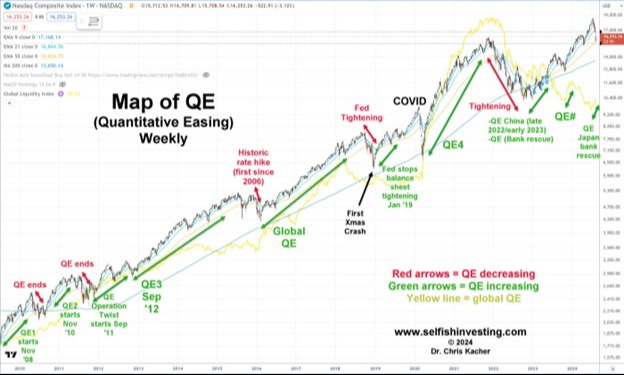
IF the facts as to why the decline occurred are valid, and IF the amount of the decline has reached a significant enough level to begin to create opportunities, and IF this was the 1 time this year that fits the 10% measure of a decline for 2024 then what should be invested in when the decline seems to have changed into a backdrop for another rally? The market entered Step 2 on Tuesday of last week recovering about a third of Monday's drop. Broad rallies lasting longer than two days imply more than simple short-covering. Last week actually closed positive for the week taking into account the bashing the market endured a week ago Monday. After rallies, there are usually retests. This is why this week seems to be quite suspect for buyers. The key to a successful retest is that fewer stocks, sectors, and markets make new lows than at the initial low. If the retest fails and markets go to a lower low, then the process returns back to step 1 waiting for another attempt at step 2. In looking at the market's action going back to the end of the Great Financial Crisis, this is very good analysis of what happened, what the Fed did, and how the market as measured by the NASDAQ growth index behaved. This is a very well annotated graph and one that should be studied to refresh one’s memory. There are two lines here. One, of the price of the index, and one, the level of QE (quantitative easing).
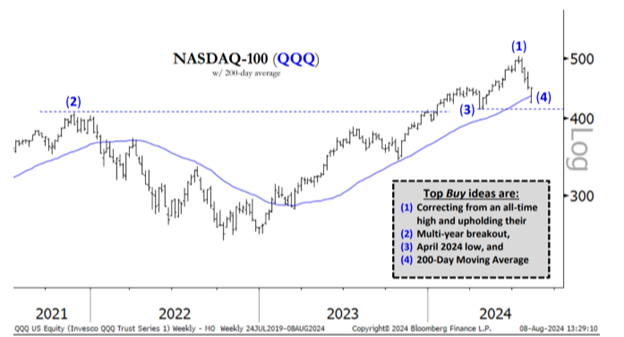
In closing, my favorite market technician Ari Wald put out a very simply chart on Monday. Ari said, "what should an investor consider investing in should a recovery in the markets begin? And more specifically, what characteristics are exhibited in price moves that tend to have the highest probability of success?" As can be seen below,
- The stock or sector should be correcting from a leading position from all-time highs.
- The stock or sector should be on a multi-year breakout after moving up and out higher from the highs of late 2021 showing healthy recovery from the 2022 bear-market period.
- The stock or sector should not violate the lows that they traded at in April of this year. A test is OK, but a strong break lower is not. It needs to be remembered that this is more of a mattress and not concrete. Meaning, it could trade lower than this point, but not by much, and if it does trade a bit lower, it could still be OK.
- The stock or sector should be holding above its 200-day moving average price.
Again, these are probability considerations, not hard rules. Every time prices move a little bit different. Just like music, every song has different words and a little bit of a different beat.
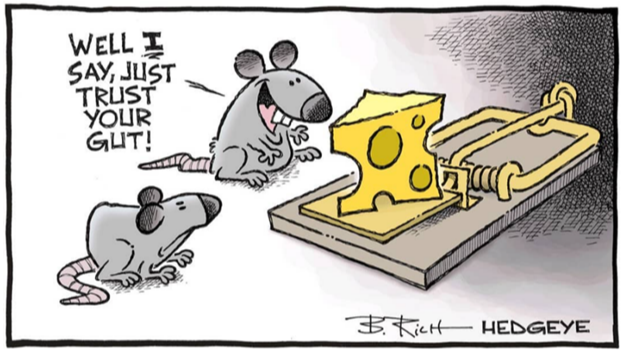
At the end of the day, an investor has to trust "their gut" and make sure that their choices are not too highly emotional but instead based on many different types of analysis. We are here to assist in answering any questions you may have and help you develop a proper evaluation in any way we can. Please don't hesitate to reach out.
- Ken South, Newport Beach Financial Advisor
Get Ken's Weekly Market Commentary Delivered To Your Inbox!
Important Disclosures:
The opinions voiced in this material are for general information only and are not intended to provide specific advice or recommendations for any individual. To determine which investment(s) may be appropriate for you, consult your financial professional prior to investing. All performance referenced is historical and is no guarantee of future results. All indices are unmanaged and cannot be invested into directly.
All information is believed to be from reliable sources; however LPL Financial makes no representation as to its completeness or accuracy.
Investing involves risks including possible loss of principal.
The Standard & Poor's 500 Index is a capitalization weighted index of 500 stocks designed to measure performance of the broad domestic economy through changes in the aggregate market value of 500 stocks representing all major industries.
The Dow Jones Industrial Average is comprised of 30 stocks that are major factors in their industries and widely held by individuals and institutional investors.
The Nasdaq-100 is a large-cap growth index. It includes 100 of the largest domestic and international non-financial companies listed on the Nasdaq Stock Market based on market capitalization.
The Russell 2000 Index is an unmanaged index generally representative of the 2,000 smallest companies in the Russell 3000 index, which represents approximately 10% of the total market capitalization of the Russell 3000 Index.
This information is not intended to be a substitute for specific individualized tax advice. We suggest that you discuss your specific tax issues with a qualified tax advisor.