


Last week was the first full week of the landslide victory for the 2024 election. As was the case in the 2020 election, the stock market rallied going into the election and then for the first week coming out of the election. Last week was a bit of a different story. Friday was the primary options expiration date for November. These option expiration dates can sometimes result in some accentuated moves, and that was even more the case this time considering Friday's expiration was most likely heavily used by traders to bet on post-election volatility. I don't think it was a coincidence that the close in the S&P 500 Friday saw the index basically "pinned" right around what had been the prior all-time high heading into the election (~5875). These obvious levels are often popular strike prices for index options, and the resultant buying/selling/hedging has a way of attracting price action to such levels like a magnet. So, while the S&P spent more time underneath that level and dropped lower than I would have liked to see on the day, it could have just been the result of option machinations.
Last week I discussed the action and importance of interest rates and the US Dollar as well. The move, almost straight up, in both of these has continued. This hasn’t proven to be a big problem- yet, but I believe we are nearing a point where interest rates could be getting high enough that they will be too attractive for stock market owners that have done quite well in 2024. These investors feel comfortable locking in some of their gains and owning high quality bonds at 4.5-5.0% interest rates. This is a constant dilemma that presents itself when two different asset classes hit extremes. In this case, the stock market is at new highs and bond prices at new lows (when interest rates go up, bond prices go down).
While the Fed maintains its easing bias, the data flow has indeed been warmer with resilient growth data and firmer inflation data of late. As all will know, the Fed is now on an easing path, but this doesn’t mean that they will ease rates at every meeting. Sometimes it takes some time for the economy to digest the Fed’s actions. At the same time, the measures of stickier inflation in the case of Consumer Prices and Consumer Spending point to an economy that is far from slowing.
When Will Higher Interest Rates Put a Lid on the Stock Market?
In contrast to the bullish response from the stock market following the election results that secured Donald Trump a second term in the White House and delivered Republicans control of Congress, the reaction from the bond market has been more apprehensive. The prospect of tax cuts and less regulation should support faster economic growth and provide a more positive backdrop for earnings. The policies, however, are also likely to be inflationary. The Fed may ultimately be unable to cut rates as much as the market was expecting.
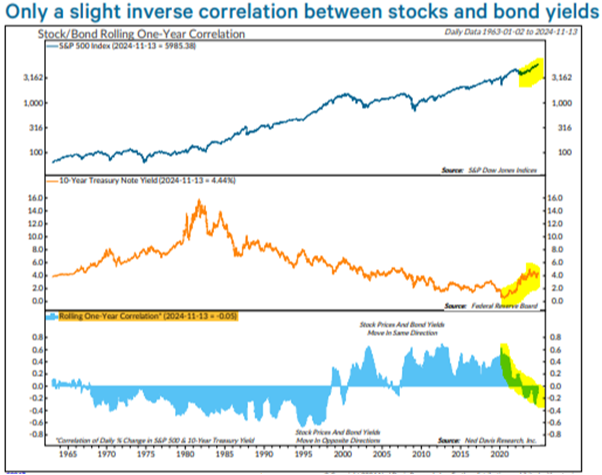
The 10-year Treasury yield jumped after the election and is now approaching 4.5%, up from 3.6% in September. The rise in yields has not been fast enough to hit levels that have derailed past stock market rallies. However, if the upward trajectory continues, those critical levels will be reached soon. The difference “this time” could be that interest rates and the economy are moving up not because there are renewed inflation expectations, but rather because it’s busy discounting the reflationary effects of the incoming Trump administration. If we take the resilient economy and add a pro-growth agenda and you get stronger nominal growth and higher neutral interest rates.
The next logical question would be whether the stock/bond yield correlation is positive or negative. When I say “correlation” I am referring to the action of one causing an action in the other. In this case the quick rise in interest rates could act as a negative for stock prices. The current situation has a very different reason for the concerted actions. A virtual change in most facets of the US Government could cause some unexpected outcomes, most of which seem to be more pro-business, less pro-government, and in so doing expansive to businesses in general. See the chart below that shows what we have experienced over time and as I have highlighted, what we are now experiencing:
Downsizing the Bureaucracy Won't Crash the Economy
The overwhelming action that needs to be done in the next administration is to downsize the size of government. In Monday’s Wall Street Journal, November 18th, the second page of the Journal was allotted almost entirely to showing the sheer size of the US Government. The title of the article was, “Some 2.3 Million People Work for Federal Government.” The new Trump Administration hasn’t wasted any time since the election win, with new information around economic policy and staffing appointments making news daily. In our opinion, the recent announcement of a new Department of Government Efficiency or “DOGE” headed by Elon Musk and Vivek Ramaswamy, has been the most important so far. Both these individuals have been making the rounds on various podcasts, before and since Election Day, speaking about plans to not only cut unnecessary regulation, but also potentially move agencies out of D.C. and downsize the headcount of the Federal bureaucracy by up to 50%. For context that would be the biggest reduction in headcount since the aftermath of WW2 as the US demobilized from the war effort. Like everything in politics there are those who oppose these ideas.
We currently have 7 million unemployed individuals bringing the unemployment rate to 4.1%, a relatively low rate historically and one that hasn’t caused the US economy to stop growing. If the “DOGE” were successful in firing 50% of Federal employees, total unemployment would rise to 8.5 million and the unemployment rate would increase to just 5.0%. If these job losses were all in the private sector, say in construction, it would lead to less production and a potential housing shortage. But, if these job losses are in bureaucracies that often interfere with production, then growth may actually accelerate. I believe this is what the US Dollar strength and higher interest rates are saying!
Further, the vast majority of these workers will find work in the private sector, where free markets more efficiently allocate resources. These are well-educated individuals with lots of potentially valuable skills that aren’t being fully utilized. The unemployment rate for people with a college degree or higher in the US is currently just 2.5%. These former bureaucrats would be able to find new jobs relatively quickly and this reallocation of talent would be an asset to future growth and innovation. The reality is that the government has gotten too darn big. The Competitive Enterprise Institute estimates that regulation costs the US economy roughly $2 trillion a year. Add in Federal, State and Local spending and over 50% of the US economy is at the whim of the bureaucracy. This puts a wet blanket on innovation, with companies spending countless hours, dollars, and intellectual manpower trying to comply with rules and regulations, rather than applying those resources toward new and innovative ways to improve consumers’ quality of life.
Markets don’t like uncertainty
With a change in Administration now taking place in Washington—it would seem quite natural for the moment to present opportunity for bears, skeptics, and nervous investors among others to find a catalyst to take some profits without FOMO (fear of missing out) midst an amazing run-up in stock prices this year and last year driven by a bull market supported by improving fundamentals and prospects for rate cuts by the Fed as the pace of inflation has slowed. Ironically markets were jostled somewhat last week by contradictive data as oil prices fell on economic growth concerns while interest rates moved higher on expectations that a healthier than expected consumer -- along with stickier than expected inflation in some of the CPI data -- could keep the Fed from cutting rates as fast and deep as some investors would like to see.
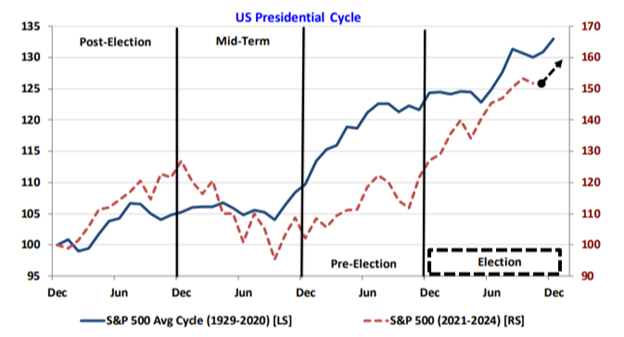
Given the vast changes in government that seem to be happening at lightening speed, the fact that the US stock market as measured by the S&P 500 Index has traded at a new high over 50 times so far this year, the fact that with Q3 earnings about done- 92% of companies have reported a robust quarter up 6.8% from a year ago, and longer-term interest rates seeming to hint to even greater economic strength with the new administration, we find ourselves asking: As Good As It Gets?. . . Our work indicates the bull cycle should extend into 2025. While we’re considering whether the As Good As It Gets moment is developing, we’ve found this point usually occurs about 6-12 months before the cycle’s top. I mean this to say that the market tends to lead the indicators that are being reported. This is why I often say the stock market is a discounting mechanism. Stock prices tend to lead the leading indicators. We expect internal deterioration to occur over a multiple-month period ahead of the S&P’s final peak. Generally speaking, the As Good As It Gets moment is when internal breadth is broadest, and poor selection has been rewarded. This is not what we are seeing.
We are on pins and needles waiting to see something go awry, but we have not seen indicators as such. In the stock market, topping action tends to be a process, where a bottom seems to be an event. We clearly just experienced an event this month, but it has yet to have initiated any kind of topping action. We will keep you informed and if we are to see something we feel warrants your attention we will certainly let you know! But as yet, the market still seems to be following the normal election cycle action. Until something changes, nothing changes.
- Ken South, Newport Beach Financial Advisor
Get Ken's Weekly Market Commentary Delivered To Your Inbox!
Important Disclosures:
The opinions voiced in this material are for general information only and are not intended to provide specific advice or recommendations for any individual. To determine which investment(s) may be appropriate for you, consult your financial professional prior to investing. All performance referenced is historical and is no guarantee of future results. All indices are unmanaged and cannot be invested into directly.
All information is believed to be from reliable sources; however LPL Financial makes no representation as to its completeness or accuracy.
Investing involves risks including possible loss of principal.
The Standard & Poor's 500 Index is a capitalization weighted index of 500 stocks designed to measure performance of the broad domestic economy through changes in the aggregate market value of 500 stocks representing all major industries.
The Dow Jones Industrial Average is comprised of 30 stocks that are major factors in their industries and widely held by individuals and institutional investors.
The Nasdaq-100 is a large-cap growth index. It includes 100 of the largest domestic and international non-financial companies listed on the Nasdaq Stock Market based on market capitalization.
The Russell 2000 Index is an unmanaged index generally representative of the 2,000 smallest companies in the Russell 3000 index, which represents approximately 10% of the total market capitalization of the Russell 3000 Index.
This information is not intended to be a substitute for specific individualized tax advice. We suggest that you discuss your specific tax issues with a qualified tax advisor.