

Stock market corrections are a part of investing. They are never fun, and they usually leave people with a lot of shoulda, coulda, woulda moments. In today’s note, I want to focus on three points that serve as road markers as to why the US equity markets are experiencing difficulties at this moment. I will end with some perspective as to where this pullback has left the market from a psychological perspective which speaks to how long this digestion could last. But beforehand, I wanted to give some commentary to the Japanese fiasco that happened Friday and Monday. In global finance when something works, we do more of it, and keep piling on as long as it works. The Japanese “carry trade,” which is when Japanese government bonds are sold, when their interest rates are near zero, costs minimal, currency looks like a long-term downtrend. Then take the proceeds, buy something else from other government securities with a better yield to stocks and indexes not necessarily in the Japanese market. The primary market that was used was the US stock & bonds markets. Lever it up, reportedly a record $2T of yen denominated borrowing by non-Japanese entities. However, on July 31, the Bank of Japan (BOJ) actually raised rates, zero to 25 basis points, not a lot but now those who shorted Japanese government debt will have to pay interest. Worse, the BOJ raising rates has reversed the declining Yen, making the short a loss. So, unwind, ala Friday and Monday to bring capital back to Japan to cover the shorts. This sucked a tremendous amount of money out of the US financial markets in short order, and at a very precarious point, hence adding fuel to the fire of the pullback.
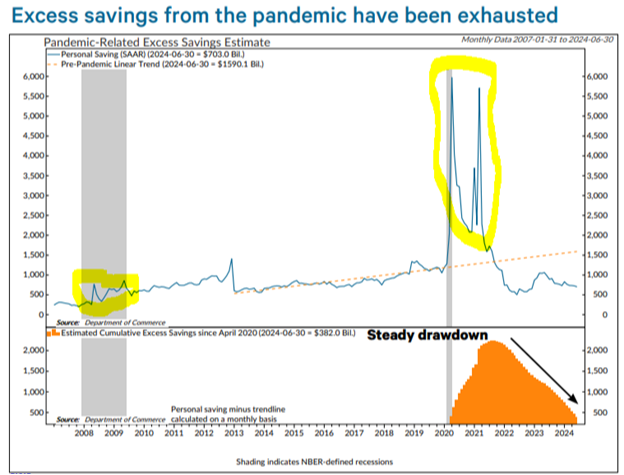
1. The end of excess pandemic savings
While markets rightfully focused on the employment data in last Friday’s report, I was less sanguine about the outlook for consumer spending and therefore a possible slowdown of the current expansion due to consumer spending. Notably, excess savings from the pandemic, as measured by the cumulative sum in personal saving from its pre-pandemic trend, fell to their lowest level in this cycle (chart below). Note that I have also circled the QE that was injected in the system following the Great Financial Crisis in 2008-2009 to give perspective to the size of the liquidity injection seen post COVID. Excess savings have been a steady source of support for consumer spending. In our estimate, they peaked at $2.2 trillion in Q3 2021 and have declined an average of $56 billion per month since then. Assuming the amount was fully spent, the excess savings drawdown could account for 4.5% of consumer spending in 2022 and 3.2% of spending in 2023. It acted as an offset to the drag from tighter monetary policy and falling real income during that time.
With the pool of excess savings practically drained, we expect consumer spending to moderate in the months ahead, which is part of the projection for slower economic growth in 2H 2024. This is also exacerbated by the restrictive monetary policy that appears to have been in place for too long.
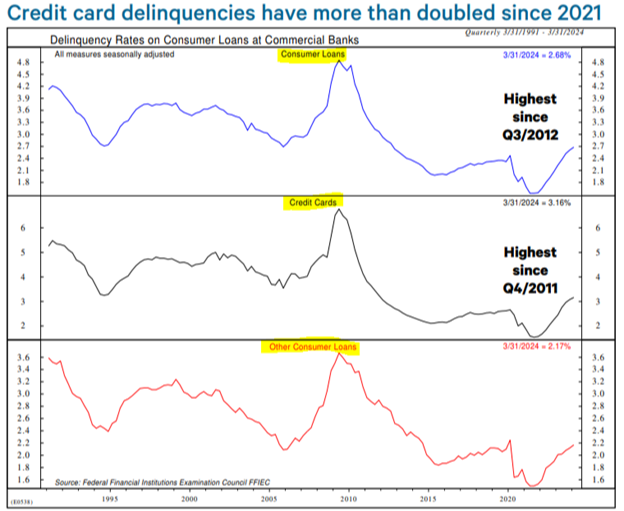
Perhaps the best expression of consumer financial stress is the loan and credit card delinquency rate. It bottomed (unsurprisingly) in Q3 of 2021 and is now at its highest level since 2012. See chart below for the progression since the early 1990’s:
2. What would warn of a downturn?
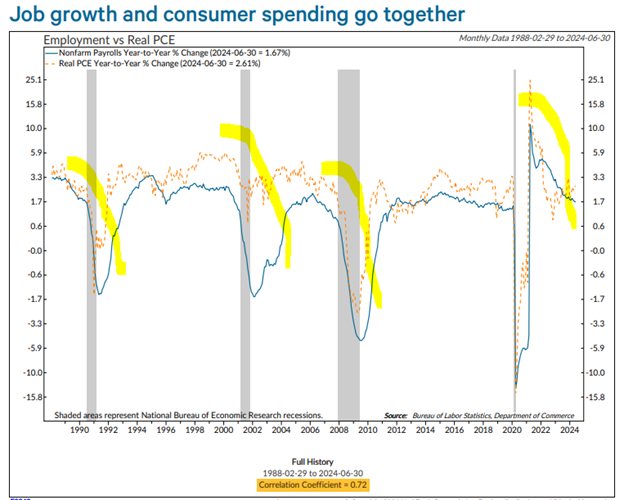
Besides the mention above of consumer spending capacity, the next major economic component is labor. Last Friday, non-farm payrolls were expected to be up 175,000 and they came in up 114,000. This is lighter than expected / hoped and could be the continuation of labor softness needed for a rate cut by the Fed soon, or at least at their September meeting. The chart below shows the strong positive correlation between non-farm payrolls and real spending growth. With excess savings gone, more of the onus for continued spending growth will fall on the labor market.
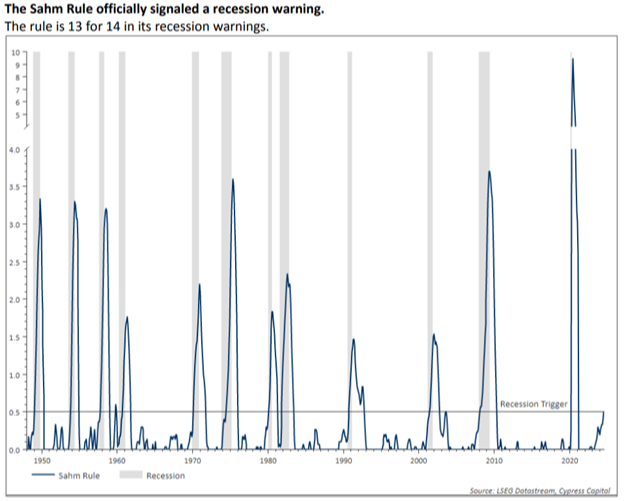
There was a rather esoteric study that was brought up in the financial press this last week for labor statistics. It is called the “Sahm Rule.” Unemployment unexpectedly climbed to 4.3%, but it was an “I told you so” moment for market watchers who follow the Household survey of employment. That rise in unemployment officially caused the “Sahm Rule” to trigger a recession warning. The Sahm rule, named for economist Claudia Sahm, is clever in its simplicity. The rule signals recession when the unemployment rate rises by half a percent or more from its low over the last 12 months. Outside of the Covid recession, we have never experienced a recession in our careers where the consensus agreed we were in recession until after it was almost over. Every successful recession warning it has triggered occurred when the economy was already in recession so at this point even the Sahm rule is somewhat suspect.
My point in bringing it up is that the economy is clearly slowing; the ultimate question is, by how much. Clearly, we won’t know this until after the fact is known. The stock market on the other hand is forward-looking and might be signaling a slowdown that is being agreed upon by interest rates as they are now declining. The underlying data is riddled with weather related impacts, but all the same, the Sahm Rule, as shown below, could be getting ready to rear its ugly head:
3. The election is now in question
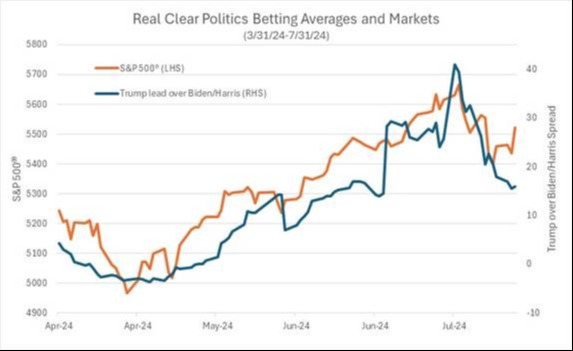
As can be seen below, it doesn’t appear to be a coincidence that the S&P 500 high and the announcement of Joe Biden stepping down from the up coming election and his Vice President stepping up happened at the same time. It’s apparent that the markets hate what they don’t know. And with this news, it clearly threw a wrench in the betting odds for the November election. Political views aside, the market views Kamala Harris as at least a credible candidate. This seems to have been enough to take the odds for a Donald Trump win back down some. Remember, it’s a case of more good vs. more bad. As of now, Harris is seen as more good (or less bad) than Biden, causing the odds gap to close. Overall, this could mean some of the steam of a Trump trade coming out.
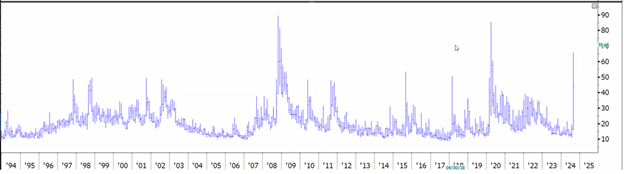
Given all these unknowns and obstacles that the markets are facing, what types of situations have markets been faced with before that they recovered from? To answer this question, I begin by looking at the volatility index, better known as the VIX. When this spikes, it has signals that the markets have exhausted themselves to the downside. As can be seen below, going back to 1994, we clearly experienced a strong VIX spike this week:
Besides the VIX spike, we have experienced a dramatic move down in interest rates in very short order. Below is a longer-term perspective of the 10-year US Treasury. As can be seen, it has been a huge move up from zero, but looks like it is taking a breather. This could be a leading indicator of the expected action from the Fed.
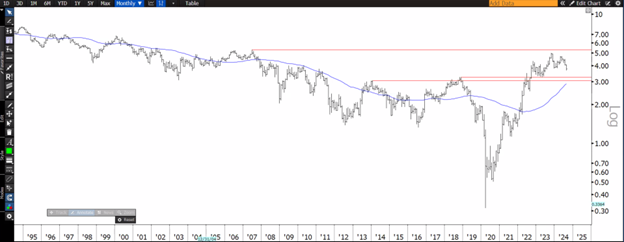
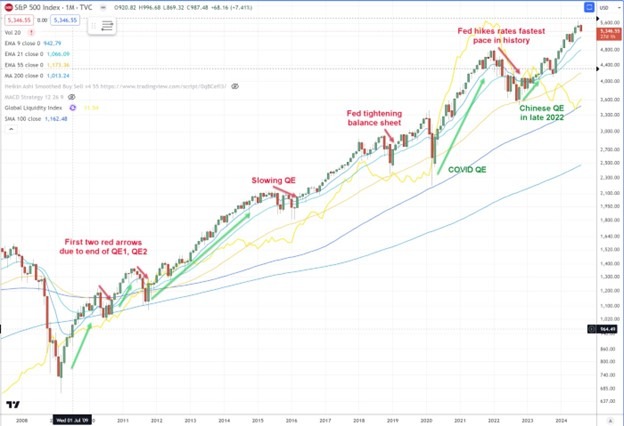
Equity markets have historically loved lower interest rates, but only when they have not been associated with a recession. If a soft-landing is what is in the cards, a continuation of the bull market advance that we have experienced could still happen. It might be taking a well-deserved breather, but higher prices might still be probable. Going back in time to the Great Financial Crisis, an annotated graphic of the uptrend the S&P 500 has been in with notations during digestion periods gives lots of history in a single picture:
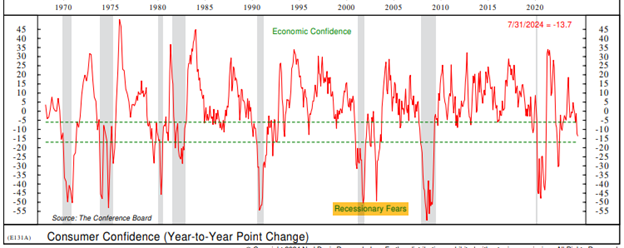
August tends to be a tough month for markets in general and this year it is proving to be true once again. Consumer confidence has not of yet indicated recessionary fears, and we would not expect this out of the current administration going into an important election, but knowing where confidence lies is still important:
We are in a market contraction the length of which is still yet to be known. As always, we will know it is over when it “was” over. At present, the US economy may be slowing, yet it is still the strongest developed market on the planet currently. Interest rates, although high, are clearly not at the levels they were in the 1980’s and real estate is still flourishing. At this point the market is blowing off some steam from an aggressive advance that began in late October of last year.
We will be sure to keep you apprised of what we are seeing and look forward to answering any of your individual questions should you want to discuss any changes in your current situation.
- Ken South, Newport Beach Financial Advisor
Get Ken's Weekly Market Commentary Delivered To Your Inbox!
Important Disclosures:
The opinions voiced in this material are for general information only and are not intended to provide specific advice or recommendations for any individual. To determine which investment(s) may be appropriate for you, consult your financial professional prior to investing. All performance referenced is historical and is no guarantee of future results. All indices are unmanaged and cannot be invested into directly.
All information is believed to be from reliable sources; however LPL Financial makes no representation as to its completeness or accuracy.
Investing involves risks including possible loss of principal.
The Standard & Poor's 500 Index is a capitalization weighted index of 500 stocks designed to measure performance of the broad domestic economy through changes in the aggregate market value of 500 stocks representing all major industries.
The Dow Jones Industrial Average is comprised of 30 stocks that are major factors in their industries and widely held by individuals and institutional investors.
The Nasdaq-100 is a large-cap growth index. It includes 100 of the largest domestic and international non-financial companies listed on the Nasdaq Stock Market based on market capitalization.
The Russell 2000 Index is an unmanaged index generally representative of the 2,000 smallest companies in the Russell 3000 index, which represents approximately 10% of the total market capitalization of the Russell 3000 Index.
This information is not intended to be a substitute for specific individualized tax advice. We suggest that you discuss your specific tax issues with a qualified tax advisor.