


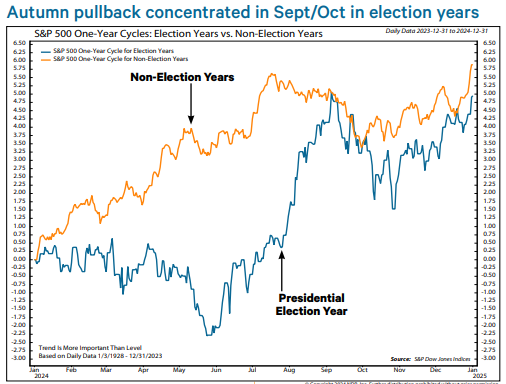
For the last few weeks, I have been talking about how September and October tend to be challenging months for the US stock market. September is historically the worst month and during election years, going into elections, traders and investors tend to sit on their hands during October as well since they can't really be sure who will be elected and how to evaluate their policies. Well, the negativity came home to roost last week with it being the worst week for the market for the entire year 2024. Not a crash by any means, but the large technology darlings got beat up once again. According to Thomas Lee of FundStrat, he feels like the volatility that customarily happens before the election is actually being pulled forward, and the difficult market action could exhaust itself ahead of schedule. The Fed is almost certainly going to start cutting rates a week from today, and the market will up the betting odds on who is going to be elected after last night's debate. Whether the debate was staged or not is up for debate according to the conspiracy theorists. But it happened and we got what we got.
To give just a bit of attention to the payroll numbers from last week, as Fed Chair Powell often uses this as his evaluative indicator for rate changes. The payrolls for August were a positive 142,000. This was positive, but less than expected, and the revised number for June and July came in at only 56,000. This was positive but it appears to have given Fed Chairman Powell what he will need to cut the rates this coming week. I want to stress that the number was still in the plus column. It was not negative. It was not recessionary. Many media hypes are still stirring the pot with the "R" word. The only real measure that they can use as fact is that the yield curve remains inverted. Remember this is when short-term interest rates are higher than long-term rates. This is called inverted because it would be logical to assume that if one were to lock their money up for a longer period of time that they should be paid more for doing so. Except if the economy is expected to slow, then by the time the instruments come due the rates should be much lower and therefore one is getting paid well even though not as much as short-term rates. It should be remembered that every recession has been preceded by an inverted yield curve, but that not every inverted yield curve has led to a recession. Oftentimes it has preceded a soft landing. Yesterday, in the Wall Street Journal there was actually an article, “The Right Reason to Buy Bonds,” that should be read for understanding and perspective.
The most important measure for mom & pop investors to see that they are concerned about is the affordability of homes. Even though the mortgage rates are substantially higher than they were post Pandemic, they are still just average historically. The hope is that besides making money cheaper for companies, the affordability of housing will be better as well. To really see what the affordability for housing currently is please see the index below going all the way back to the mid 1980's.
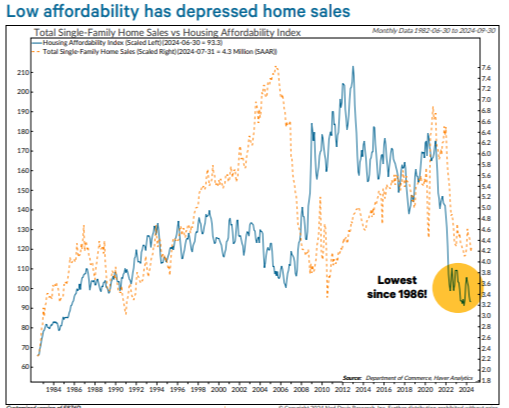
The reality is that lower interest rates, in a lack of recession, tends to only force prices higher when the residential market continues to be as competitive as it has been. Even the Sunday New York Times wrote an article about it, titled, "The Downside of Falling Interest Rates." Looking at the economy, the earnings season for Q2 is almost completely wrapped up, and investors only now have today's CPI index, yesterday's debate, and next week's Fed decision to fuss about. 99% of the firms in the S&P 500 index have reported and earnings collectively are up a robust 11.6% from Q2 of 2023 on revenue growth of 5.3%. Given this strength, I believe this argues for a smaller rate cut than many are hoping for and quite possibly no cut at all. This is why even though we are entering the difficult period for the markets- seasonally, I still have a strong bullish bent. I am not deterred by near-term hysteria or unexpected economic data but rather am focused on the continued positive growth out of the consumer and many businesses.
This autumn pullback should exhaust itself and end up being supported by a soft landing. In a research report by Mike Zaccardi, he found 10 reasons why a soft landing is what he is seeing in the future. His facts were as follows:
- Jobs numbers are lower but not a sign of slowing and recession.
- Wage growth accelerated 3.8% in August and wage growth was sticky and above pre-pandemic levels.
- Daily data for debit card purchases showing consumer spending accelerating.
- Weekly data for retail sales went up in the last report and remains solid in general.
- Jobless claims have declined for several weeks.
- Continued claims have declined for several weeks.
- Default rates and weekly bankruptcy filings are trending down.
- The Fed's weekly GDP model suggests GDP is still strong at 2.4%.
- Weekly profit forward forecasts for S&P 500 profit margins are near all-time high levels.
- The stock prices of staffing firms are rebounding, which suggests we could get a rebound in job openings.
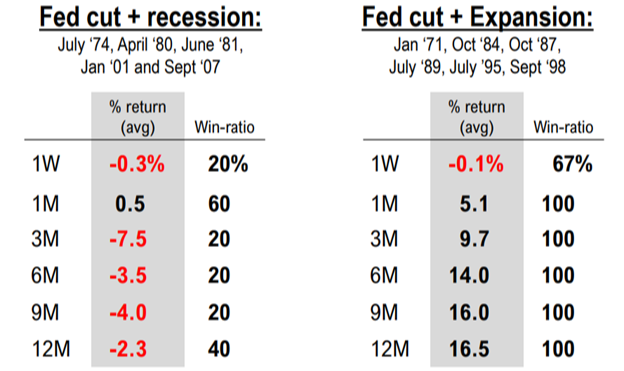
See below what happens when the Fed cuts interest rates and the economy is still in an expansion. 100% of the time the markets act better after a week. I of course cannot guarantee this would be the case this time, but again, as far as probabilities are concerned, it seems to have very little to do with an election and a lot to do with liquidity expansion and easier access to capital for corporations both large and small.
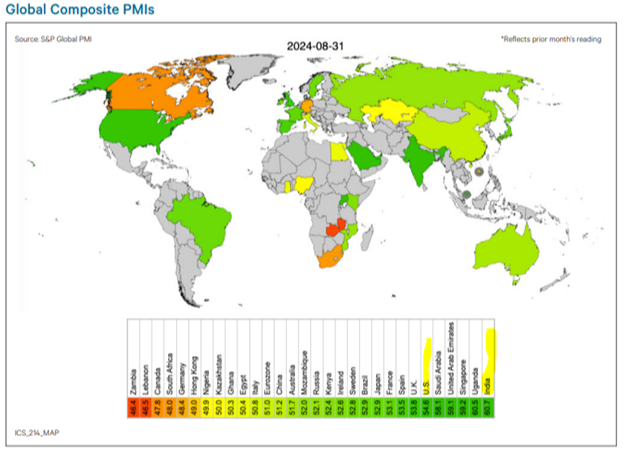
According to NDR Research, Global Composite PMI readings are still leaning positive. As seen below, the US is still in the top 6 and India remains number one. I find this important to take a global view of whether the world is teetering on recession or whether the media is simply trying to continue its scary tactics. As I like to say, “I still see a lot of green on this screen.”
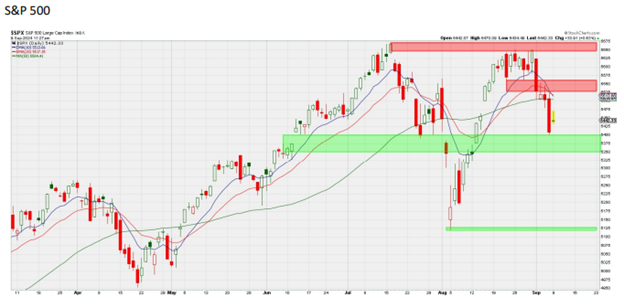
Putting all this economic data aside, I think it makes sense to look at what the market index price is saying. In looking below, I would like you to focus on the red bar at the top of the chart. The S&P 500 clearly had a "double-top" sort of formation, but below that what I see is a "head-and-shoulder" bottom in a longer-term uptrend. The head is the spike down in July, and each shoulder is in mid-June and just last week. You will notice the heavy green bar at the shoulder. These tend to resolve to the upside when the overall trend in the market is higher.
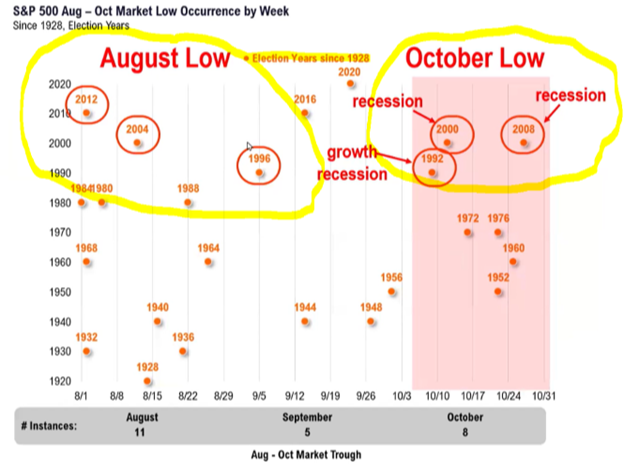
If the work of FundStrat proves to be valid, lows tend to fall in October during recessions (1992, 2000, and 2008) and if not during a recession in August (1996, 2004, and 2012). See below. I've circled the recession and non-recession bottom month years.
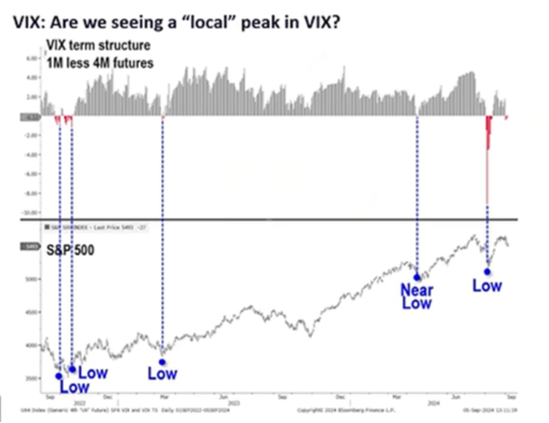
I wanted to get some more facts about seasonal activity, so I went back to 1950 to examine what the second half of the year could provide, given the first half that we have experienced. I found a very interesting probability. If the first half of the year had a performance return greater than 10%, the second half had an average return of 9.8% and this occurred with an 83%-win ratio. These are good odds! I am particularly hopeful of this being the case as September has started quite dreadfully. The measure of how dreadful this corrective spike lower has been is often measured in velocity by looking at the level of the VIX (volatility index). Going back to just after the pandemic, spike points in the futures market for the VIX have pretty consistently corresponded to lows in the broad index. Quite possibly the moves lower in July and this last week could have marked low points in the index and might just be setting the stage for the hopeful year-end rally.
According to hedge fund legend Ray Dalio, in an interview in Barrons this past weekend. He said specifically:
- Bonds- rates are a bit too low. There is already a lot of easing built into the yield curve. "I'm not sure that you're going to see the amount of easing."
- Stocks- "When I look at stocks, they appear a bit high. The big risks are political. You could see one side not accepting losing and changes in tax rates, capital gains, and unrealized capital gains, these would be negatives for the market."
- Economy- "I think the economy is under the normal scenario; it's doing just fine, except for the great polarity in our society (political specturalism)."
I take this to mean that he is in the soft-landing camp for rates, that the stock market is really going to depend upon a continuation of earnings and revenue growth (as it should be) and the economy is just fine as long as some crazy socialist style tax changes aren't thrown in the mix. This is a lot of charts and facts for a hot summer September, but I will continue to provide what I feel are salient facts and historical statistics to pay attention to in managing through a truly historically turbulent, election time.
- Ken South, Newport Beach Financial Advisor
Get Ken's Weekly Market Commentary Delivered To Your Inbox!
Important Disclosures:
The opinions voiced in this material are for general information only and are not intended to provide specific advice or recommendations for any individual. To determine which investment(s) may be appropriate for you, consult your financial professional prior to investing. All performance referenced is historical and is no guarantee of future results. All indices are unmanaged and cannot be invested into directly.
All information is believed to be from reliable sources; however LPL Financial makes no representation as to its completeness or accuracy.
Investing involves risks including possible loss of principal.
The Standard & Poor's 500 Index is a capitalization weighted index of 500 stocks designed to measure performance of the broad domestic economy through changes in the aggregate market value of 500 stocks representing all major industries.
The Dow Jones Industrial Average is comprised of 30 stocks that are major factors in their industries and widely held by individuals and institutional investors.
The Nasdaq-100 is a large-cap growth index. It includes 100 of the largest domestic and international non-financial companies listed on the Nasdaq Stock Market based on market capitalization.
The Russell 2000 Index is an unmanaged index generally representative of the 2,000 smallest companies in the Russell 3000 index, which represents approximately 10% of the total market capitalization of the Russell 3000 Index.
This information is not intended to be a substitute for specific individualized tax advice. We suggest that you discuss your specific tax issues with a qualified tax advisor.