


As we round the corner on the 2024 election hype, it is clear that the American public is on edge due to media coverage. Whoever your candidate may be, and whether you like Joe Rogan, Tucker Carlson, or some CNN reporter, as the Wall Street Journal stated Monday, “Ahead of Nov. 5, America Is Stressed Out.” Voters on each side see damage to the US whoever wins; ‘a lot of marijuana’- is how the article starts out. Clearly, we are seeing a high point in media hysteria this week and I welcome November the 5th when, hopefully, our domestic angst subsides.
I give much attention to “tone” as much as “content” when reading research and newspapers. This last weekend there really just wasn’t much left to say. My favorite weekly comments that I wake up to every Saturday are Ari Wald’s technical comments. This weekend there was not much more than the first four pages where Ari said clearly, “We remain steadfast in our advocacy for momentum factor at this stage of the bull cycle and are therefore encouraged that the factor (and the major markets) reached a new relative high last week. Rather than ‘anticipating’ the ebbs and flows of a bull market, we think investors should be more kindly rewarded by buying high-momentum when the market corrects and selling low-momentum when the market rallies- TAKE WHAT THE MARKET GIVES.” Basically, don’t fight the trend, and make sure if your intent is to be invested in risk assets, stick with what is working and get rid of what isn’t.
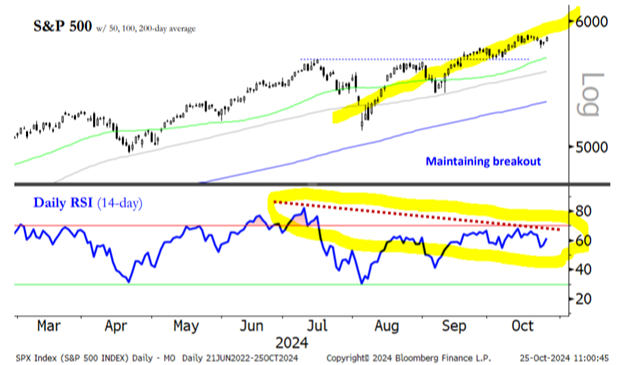
It seems that many market prognosticators are saying that the market is at new highs and have been at new highs too long and therefore should be selling off. Last week has historically been the worst week for the broad markets in election years, and even this last week the S&P dropped a mere 56 points ~ 1%. What we are seeing is more of a market that has not changed its complexion but rather seems to have decreased the speed of its ascent and as such possibly preparing for the next move higher. Check off the boxes: US Dollar- stable, Interest Rates- showing economic stability, Market Index Pricing- still on a consistent advance, Earnings Reports- beating estimates, Forward Earnings Estimates- few negative surprises. In a nutshell, I am waiting for something to spoil but the fruit in the fridge is still good and no mold on the cheese! Instead, as referenced below, the Daily RSI (relative Strength Index) has come down from July highs, but seems to be just resting.
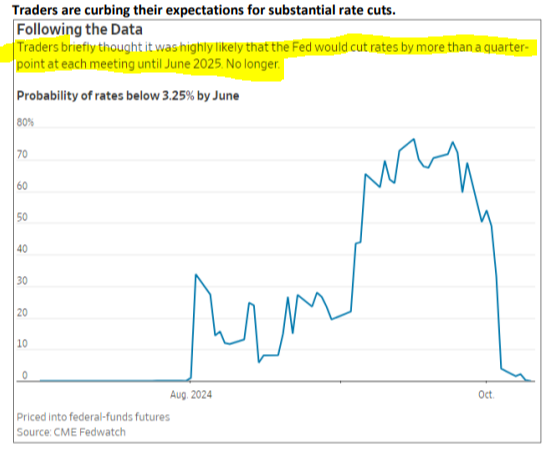
So, the next question that could logically be asked is: What’s the market telling us? From our chairs it looks to us that it’s telegraphing better things ahead for stocks and the normalization for the bond market with interest rates to move somewhat lower as the Federal Reserve board feels more comfortable easing interest rates lower while keeping its eyes on inflation to avoid a flash back of sticky inflation and to keep unemployment at a rate of 4% or lower. After delivering 11 rate hikes and nine pauses from March of 2022, the Fed cut its benchmark rate by ½% on September 18th and now at the ready for more if it feels prudent.
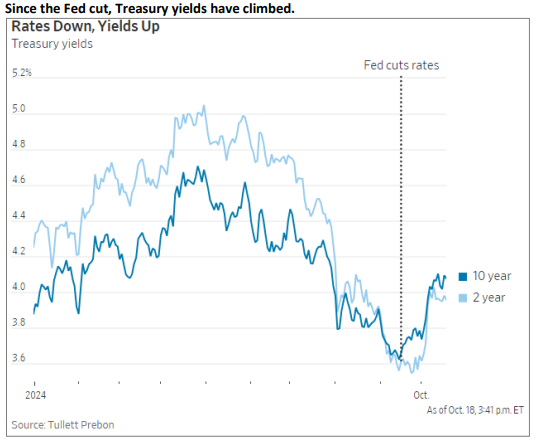
Aside from stocks and high yield money markets, investors look to high quality bonds as part of their investment arsenal. And at the moment, I cannot say that bond funds, in particular, offer a great alternative to money markets. True, they may yield a little more in some cases, but it comes at the expense of higher risk. Moreover, with interest rates rising over the past few years as inflation has picked up, it should no longer be assumed that rates are just going to go down and bond prices will go up. For instance, back during 2020-2022, the iShares Core U.S. Aggregate Bond Fund (AGG), one of the largest fixed income ETFs, lost around 23.5% on a price basis. The yield that investors picked up along the way improved total returns to some degree, but on a net basis, investors in this fund and similar ones lost a lot of money (compounded by rising inflation). Even more recently, AGG is down over 3% just since the middle of September. With a 4.2% 30-day SEC yield that is less than the ~4.5% one can get in some money market funds, it's hard to produce a good reason to invest in something like AGG rather than just keeping cash in a money market fund. So, for those more interested in safety of principle, it's not hard to see why many may choose to just hold their cash in a money market fund. See the latest directional move interest rates below:
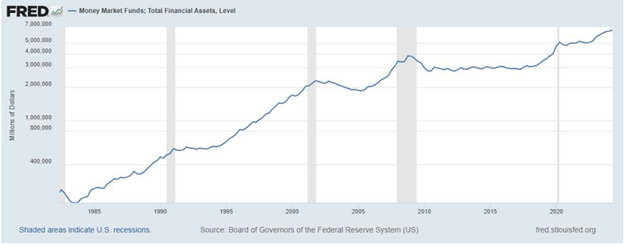
Assets in Money Market Funds at Record Levels but Don’t Be Fooled
The total assets in money market funds currently sits at an all-time high above $6 trillion. I frequently hear these assets referred to as “cash on the sidelines” and often it is suggested or outright stated that the market “can’t” fall because of all this money waiting for any dip to buy. There are several issues with that. Suffice it to say that it isn’t this cut and dry, and there are many other variables to consider. I also want to point out here, though, that the major bear markets that followed the 2000 and 2007 tops in stocks occurred despite money market funds being at what were then record highs. Furthermore, the trend in money market fund levels throughout history has basically always been “up.” As the money supply grows and more capital seeks out returns, this should be expected. It is not unique to our current situation. Here is the Fed’s illustration of Money Market Fund Balances:
Finishing my comments on money market balances and the forward risks associated with bonds, I wanted to share the action out of institutional bond market traders. As the picture above, “rates down, yields up” shows, interest rates in longer maturities rising, it is no shock that they don’t feel the Fed will be aggressively lowering rates out in the near future.
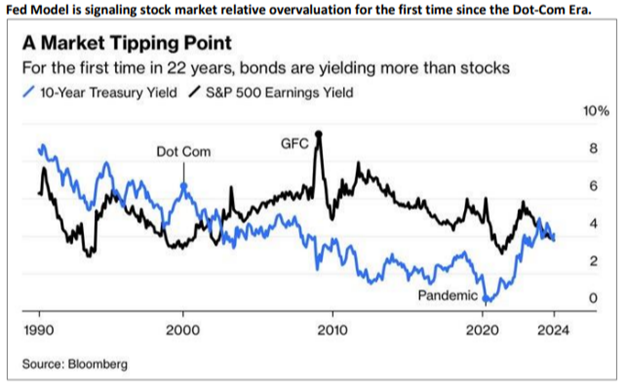
All of this being said, we should not overlook the fact that the stock market remains historically overvalued. From an asset allocation perspective, it's probably prudent for many to keep an increased amount of capital in cash rather than keeping it fully invested in stocks (baring negative tax implications for doing so.) Even if, on aggregate, the average investor moves from an 80/20% stock/fixed income split to a 60/40% one (I am just making these numbers up), that could mean a swing of trillions of dollars. I would like to think that investors are just acting on emotion rather than being wise after learning their lessons after the bear markets that followed 2000 and 2007, though I doubt human nature itself, has changed in the past few years. I think there are reasonable explanations as to why there is so much "cash on the sidelines" right now, though it is a mistake to assume that all of that is potential fuel for the stock market. So, again, I would not assume that high cash levels mean the market “can’t” fall significantly.
Bottom Line The stock market has remained, for lack of a better word, boring. It is somewhat of a surprise given we are now just a week away from election day. Don’t get me wrong, I try to be one of the first to downplay such events like elections on the market but that usually doesn’t stop everyone else from overreacting. The media can get in people’s heads far more often than I can. Instead, the pre-voting day moves have been very muted, with limited upside and downside in the major averages. Things did look like they could be getting more exciting last week, however, there was little-to-no downside follow-through, and key support levels continue to hold across the board. The first support test for the S&P 500 is now in the 5760-5800 zone. Above there, anything goes, and everything is fair game. Risk will only begin to elevate with a sustained break below there and increase the odds that the more major region around 5650-5675 will be tested next. Unless we start to see areas such as these be violated, it is hard to say much more than just “follow the trend” and defer to the upside. We are getting more earnings reports on a daily basis now, which will hopefully open up some more opportunities. Excitement is usually a bad word when it comes to the markets, but it would be nice to see just a little more action!
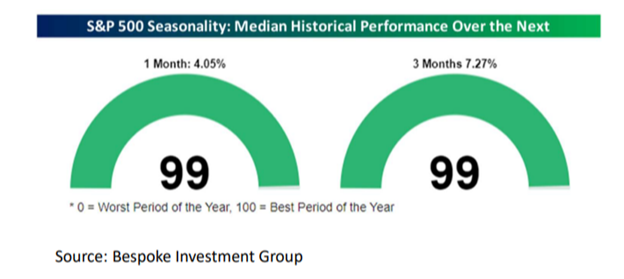
But We Have Now Entered the Best Seasonality of the Year
As always, seasonality is only a guide rather than a guarantee. We have just come out of what has historically been a poor seasonal period, yet except for a couple of hiccups the stock market did not experience much in the way of major declines. Now, we have entered what has historically been the best time of the trading calendar. As Bespoke Investment Group noted, 1-month and 3-month S&P 500 seasonality was in the 99th percentile coming into this week. I know many are expecting a postelection ramp into year-end since that is what occurred in 2016 and 2020. We’ll just have to see if it actually happens, though history does offer some tailwinds. Here is Bespoke’s Seasonality chart:
With the S&P 500 Index up 64% since the October 10, 2022 low, and 21.8% year-to-date, for the best start to an election year since 1936, it has appeared logical to possibly pause and check if it is time to head for the exits. The list of reasons for this action is long and varied. Ours include the spike in long-term interest rates, the threat of higher inflation, labor market and manufacturing weakness, geopolitics, excessive optimism, and potential earnings growth deceleration in 2025. I am confident you have others on your list. But in the end, long-term investing rather than short-term speculation has proven to be the best course of action. We will of course remain quick on the trigger should a black-swan arise, or should support levels be broken, but for now, the trend is your friend till it ends.
- Ken South, Newport Beach Financial Advisor
Get Ken's Weekly Market Commentary Delivered To Your Inbox!
Important Disclosures:
The opinions voiced in this material are for general information only and are not intended to provide specific advice or recommendations for any individual. To determine which investment(s) may be appropriate for you, consult your financial professional prior to investing. All performance referenced is historical and is no guarantee of future results. All indices are unmanaged and cannot be invested into directly.
All information is believed to be from reliable sources; however LPL Financial makes no representation as to its completeness or accuracy.
Investing involves risks including possible loss of principal.
The Standard & Poor's 500 Index is a capitalization weighted index of 500 stocks designed to measure performance of the broad domestic economy through changes in the aggregate market value of 500 stocks representing all major industries.
The Dow Jones Industrial Average is comprised of 30 stocks that are major factors in their industries and widely held by individuals and institutional investors.
The Nasdaq-100 is a large-cap growth index. It includes 100 of the largest domestic and international non-financial companies listed on the Nasdaq Stock Market based on market capitalization.
The Russell 2000 Index is an unmanaged index generally representative of the 2,000 smallest companies in the Russell 3000 index, which represents approximately 10% of the total market capitalization of the Russell 3000 Index.
This information is not intended to be a substitute for specific individualized tax advice. We suggest that you discuss your specific tax issues with a qualified tax advisor.