


Last week I titled the report the “Human Condition.” I really meant this to confirm that we are all becoming increasingly short-sighted in our observation of things. Given the immediate and spectral nature of the internet and social media, the world has become hyper-sensitive to anything and everything. This spills over into demanding more and more information, often when there just simply isn’t any more information of relevance to provide. Thomas Lee showed an illustration that I found to be the perfect “a picture is worth a 1,000 words.”

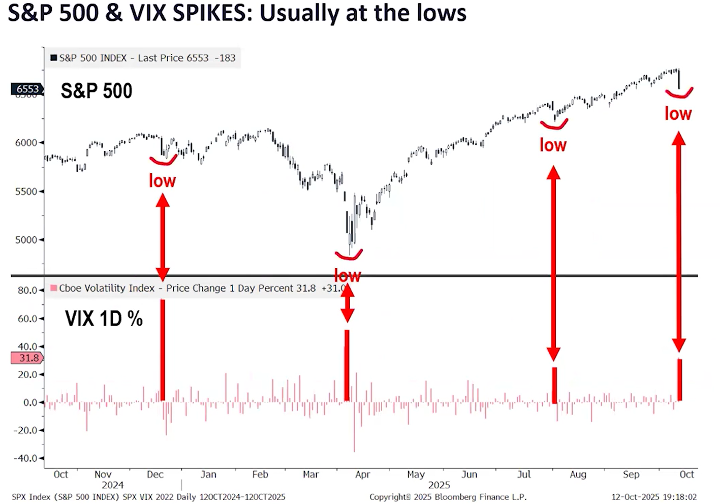
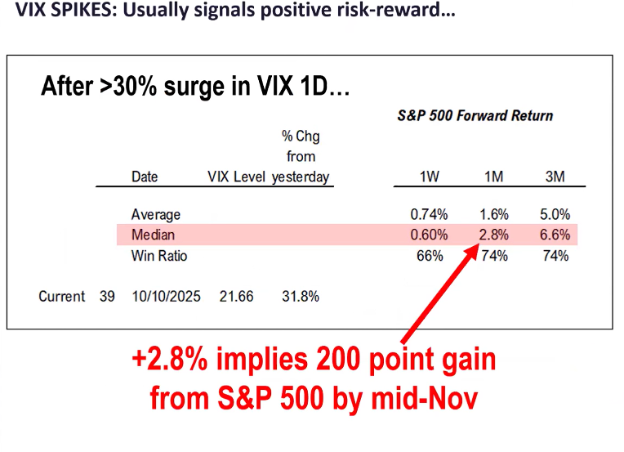
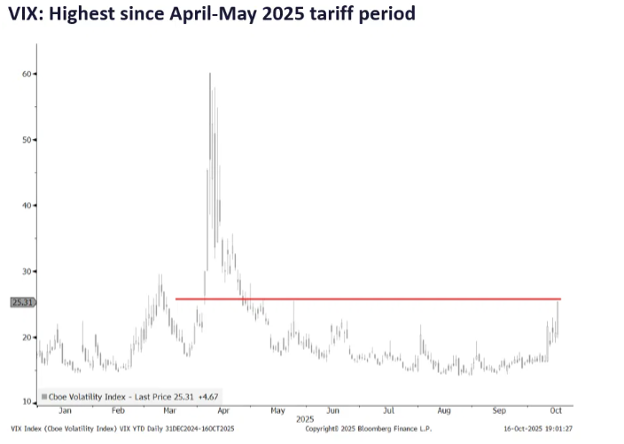
The way that an extreme is measured tends to be the VIX (the volatility index). Often the VIX tends to spike when there is a volatility event like we experienced a couple of Fridays ago. Again, FundStrat shared a chart reflecting these volatility spikes going back to late 2024. As seen below, these volatility spikes tend to occur at short-term lows in the markets. I don’t give too much credit to this as this entire time the market has been going up. Once there is some level of decline, it will be interesting to see if the VIX presents the same message.
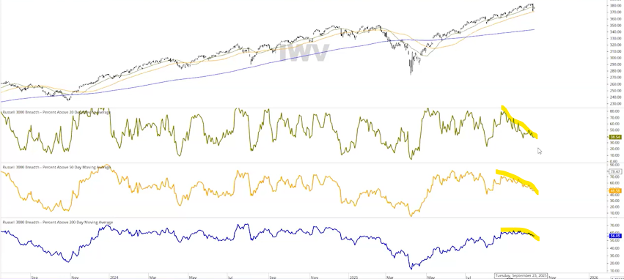
In looking at the broad market, even though prices logged new highs in the first week of October, the internals were far less robust. See below, the very broad Russell 3000 index shows across the board, company above their 20-day, 50-day and 200-day have been rolling over and going lower since late August.
What is often seen is that the market will hold itself up and hold itself up, and baring any negative and unforeseen event, it eventually will just take a breather. Everyone is always looking for a reason and this time it was a “rerattling” of the sabers with China. I really feel that it was a Friday, a bank holiday on Monday, and major bank earnings the following week. Many simply thought, “Heck, we have done really well- better than forecasted, so this is a good time to take a little off the top.” This is clearly just my supposition, but lacking any concrete reasons this would be somewhat logical.
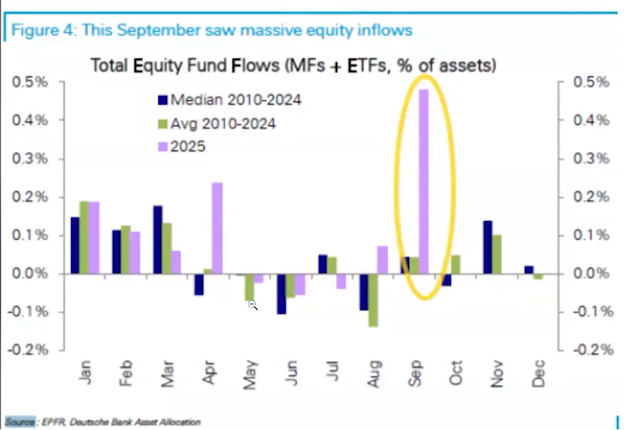
Often times institutional or highly speculative- shorter-term investment pools will tend to do the opposite of what the investor on the street will do as well. In this particular case, as seen below, the investor on the street poured massive amounts into mutual funds and ETFs in September, and it would not surprise me to have this be a good reason for institutional investors to pull some off the table and take profits at the same time as the masses put money in:
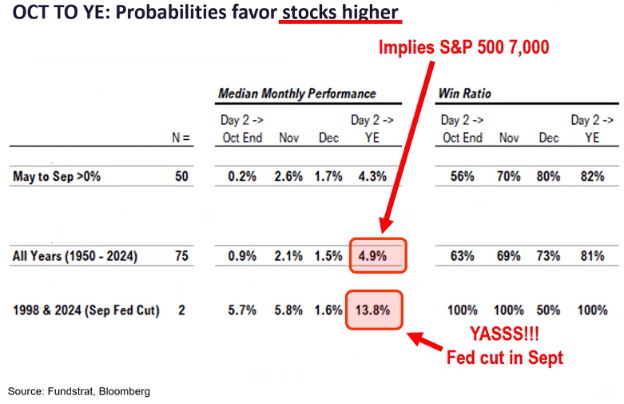
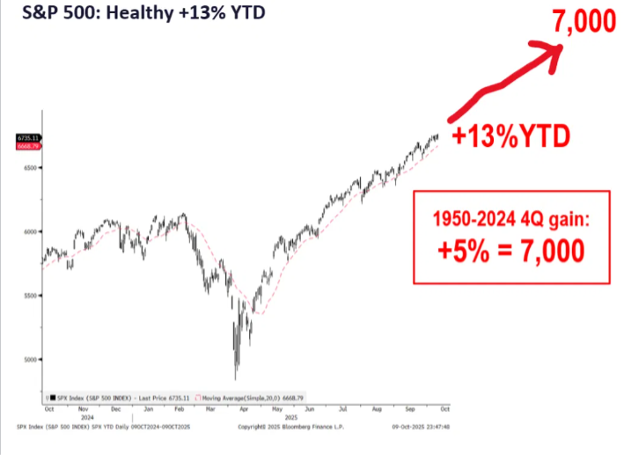
And his year-end expectations are still unwavering. In all years since 1950, if the performance is positive from May to September, of which there were 75 cases of this over this time period, the return into year-end has been positive, with an 81% probability, of a performance averaging 4.9%. The shocking statistic is that if there are rate cuts in this period, as there were in 1998 and 2024, the performance average in those two cases was 13.8%, and positive like this 100% in both cases.
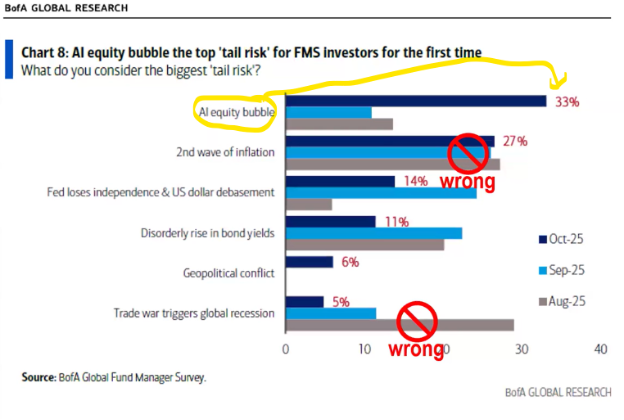
The next logical question is “why” these probabilities could possibly NOT be the expected outcome. In this case, this time, it seems to be centered around the AI bubble and the trade wars. As can be seen in the BofA Global Research study below, the AI bubble is the biggest fear in 2025. Does this play out? We have three months to see, but if earnings come in much stronger than expected, as has been the case so far in the last week, these fears could be wrong as well.
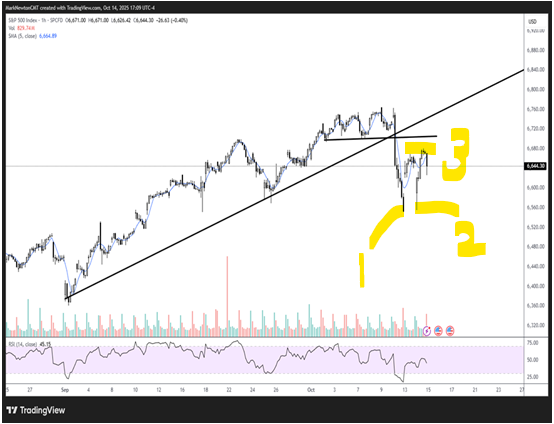
On a very short-term basis, as this seems to be where most peoples’ heads are at, the question that I have been getting is the one about how the markets, which have been relatively quiet in their movement all of the sudden went haywire on Friday, most all of last week. What we look for in the technical analysis world is for the market to put in an initial low, try and go higher, then try and go back down and break the low. If the initial low is broken, then chances are the iniital low was not the low, and there could be a lower low in the near future. If the low is held, and retested, then this could be a durable low or digestion and the markets then continue on the trajectory they were on before the sell-off. Here is the picture of the last trading days. It can be seen that Friday a low was put in. Monday the market tried to go down again and really couldn’t. Then on Tuesday a valid attempt was put in to break Friday’s low and this was avoided as well.
Then, we would look for an advance higher to possibly show that the uptrend continues to be intact and that the advance is quite possibly done with its correction and ready to advance further. This occurred on Wednesday of last week with the move above 6,700 on the S&P 500. Now we can see if the statistical data I mentioned above exhibits its consistency once again.
Beyond the historical and statistically measurable points I’ve covered above, we have the here and now. Or, more specifically, the reason why this October, like many others, tends to be a bit difficult to navigate in the short run. As strange as it may be, we hit a new all-time high in many indexes just a week ago, or more specifically just 1-3% ago from the highs, and the sentiment indexes have declined precipitously. The AAII gauge of the individual investor sentiment has plunged:
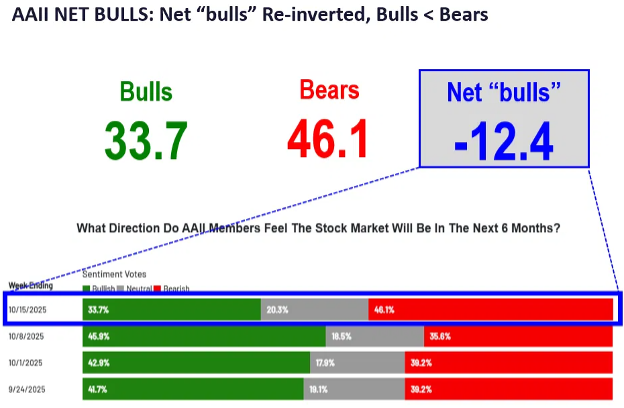
Notice above that the percentage bears (negative) has moved from 35% to 48% in just one week. Also, the CNN Fear & Greed Index has also shown a quick decline to extreme fear:
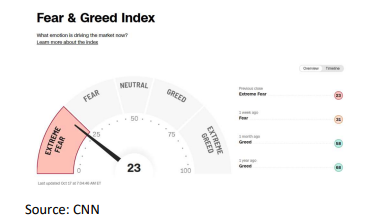
Even the US Equity market fear gauge, better known as the VIX has now moved up to a level that is the highest since the April bottom. Given a lack of solid information that foretells a negative future, I find this to be indicative of how short sighted investors are currently.
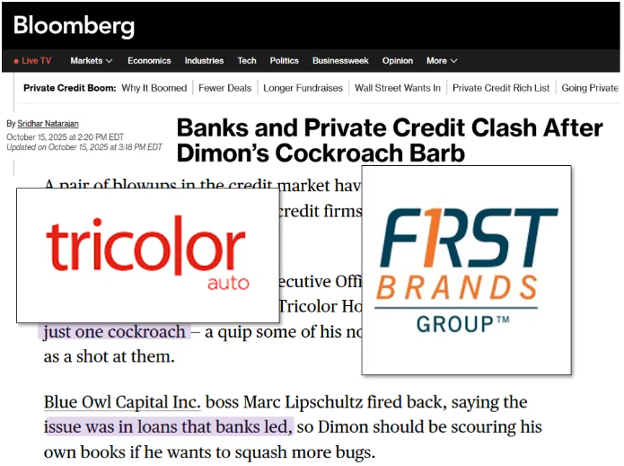
I take these all as a reason to be cautious, but not any more cautious than normal. Whenever I see emotional times like this I look for economic proof for a reason to be excessively negative. Aside from the two companies that declared bankruptcy this last week I cannot find major problems in the economy from the perspective of earnings.
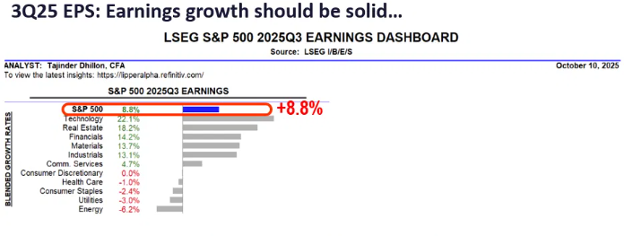
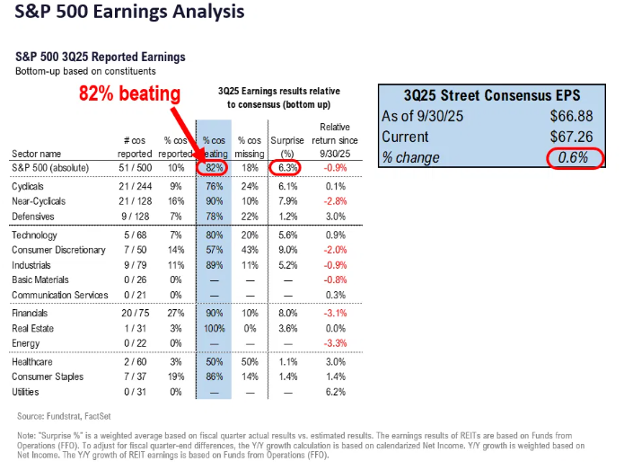
We are currently in the throws of earnings season for the third quarter and pre-announcements for the fourth quarter. As can be seen below, third quarter is expected to be up almost 9%, primarily led by technology:
Through Thursday of last week, this is the scorecard for the S&P 500. Note that 82% are beating estimates by a surprise of 6.3%
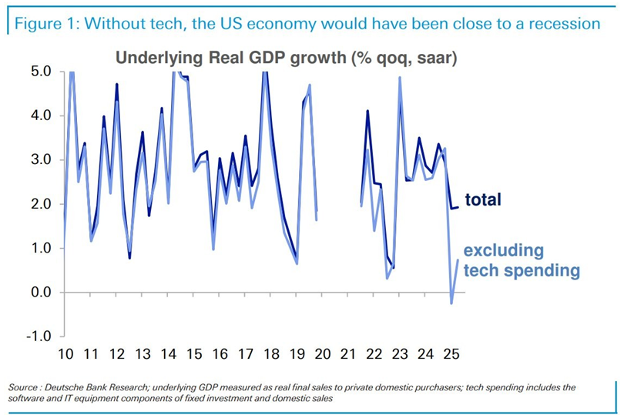
Deutsche Bank Research did a very interesting study and showed that if it weren’t for the extreme strength in technology earnings, overall economic growth would be quite paltry. I believe this further supports the incredibly benefit of AI and efficiencies of technology in general.
In closing, I am feeling the digestion in major leading companies that have gone on in the last week, but at the same time, I am relieved to see some level of pause to refresh. I believe that the pause is the result of the two bankruptcies and general negative sentiment. But looking out into the end of 2025, I still feel that the future could be as it has been since the rise began in April. According to Thomas Lee of FundStrat, he still feels that the statistics presented at the beginning of this note hold the most importance and that we could still see higher prices into year-end. Boy oh boy, let’s hope that he is right!
- Ken South, Tower 68 Financial Advisors, Newport Beach
-
Get Ken's Weekly Market Commentary Delivered To Your Inbox!
Important Disclosures:
The opinions voiced in this material are for general information only and are not intended to provide specific advice or recommendations for any individual. To determine which investment(s) may be appropriate for you, consult your financial professional prior to investing. All performance referenced is historical and is no guarantee of future results. All indices are unmanaged and cannot be invested into directly.
All information is believed to be from reliable sources; however LPL Financial makes no representation as to its completeness or accuracy.
Investing involves risks including possible loss of principal.
The Standard & Poor's 500 Index is a capitalization weighted index of 500 stocks designed to measure performance of the broad domestic economy through changes in the aggregate market value of 500 stocks representing all major industries. The S&P 500 is a stock market index tracking the stock performance of 500 of the largest companies listed on stock exchanges in the United States. Indexes are unmanaged and cannot be invested in directly.
The Dow Jones Industrial Average is comprised of 30 stocks that are major factors in their industries and widely held by individuals and institutional investors.
The Nasdaq-100 is a large-cap growth index. It includes 100 of the largest domestic and international non-financial companies listed on the Nasdaq Stock Market based on market capitalization.
The Russell 2000 Index is an unmanaged index generally representative of the 2,000 smallest companies in the Russell 3000 index, which represents approximately 10% of the total market capitalization of the Russell 3000 Index.
Data sourced from Bloomberg (2025).
Stock investing includes risks, including fluctuating prices and loss of principal.
Bonds are subject to market and interest rate risk if sold prior to maturity. Bond values will decline as interest rates rise. Bonds are subject to availability, change in price, call features and credit risk.
Government bonds are guaranteed by the US government as to the timely payment of principal and interest and, if held to maturity, offer a fixed rate of return and fixed principal value.
Bond yields are subject to change. Certain call or special redemption features may exist which could impact yield.
International investing involves special risks such as currency fluctuation and political instability and may not be suitable for all investors.
Alternative investments may not be suitable for all investors and should be considered as an investment for the risk capital portion of the investor’s portfolio. The strategies employed in the management of alternative investments may accelerate the velocity of potential losses.
This information is not intended to be a substitute for specific individualized tax advice. We suggest that you discuss your specific tax issues with a qualified tax advisor.
The economic forecasts set forth in this material may not develop as predicted and there can be no guarantee that strategies promoted will be successful.
LPL Tracking #813809