


It has not been unusual for the stock market to get off to a good start to the year. January is, on average, one of the best months on the calendar, though when trouble does arise it tends to occur in the middle of the month. The fervently complained about lack of a Santa Claus Rally (by the liberal media) caused the market little issue during its first full trading week of the year. Investors breathed a sigh of relief as stocks expanded higher in a manner that looked very much like what we saw for most of 2025. I still would not call it a bullish "explosion" by any stretch, but broad market measures continued to grind upward while dips at this point almost require a magnifying glass to spot. The gain in the S&P 500 during the first week of the year could be important because the "first five days" indicator has an impressive historical track record. The S&P finished the year in positive territory around 83% of the time, for an average gain of 14% when the first five sessions were also collectively positive. In short, the market still hasn’t provided a good reason to fade this ongoing rally.
To continue this point, if the market rallies in the first five days of the year the market tends to be positive for the year. Since 1950 this has been the case 100% of the time. I like these odds! The market has sort of been on a tear since it finished its indigestion back on December 19th.
It has been up three years back-to-back and this has only occurred four times since 1950, so the statistics seem to matter even more when this is considered. In looking at these four instances, if the markets are up in the first five days it has been positive 100% of the time and it has gained 20%. This would be another barn burner year! Now, if the market was down in the first five days, following three up years, the market was positive only one time out of the four.
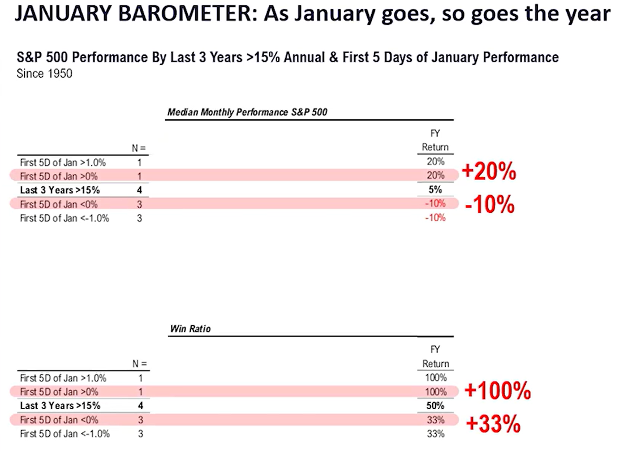
Besides Thomas Lee and Mark Newton of FundStrat, one of the oldest (could be oldest market commentator still writing) market prognosticators is Larry Williams. He has been around so long and is so highly respected that there is actually a market oscillator named after him, “The Williams %R.” This is a key tools for identifying overbought/oversold conditions. Larry writes an annual letter that I find important and one that I reference throughout the year every year. Well, this past weekend, Larry wrote an addendum to his annual based on the “Rule of the first week.” Here it is,
2026 Bullish Confirmation
January 10, 2026 – Special Research Results
I wanted to share some of my latest research and analysis with you post release of this year’s report.
Yale Hirsch and his son Jeff (authors of the famous, annual Stock Trader’s Almanac) have shown that a positive change, from the last trading day of the year to the 5th trading day of the new year, portends a bullish year (positive first 5-day percent change).
Consider this … in the last 76 years of trading (going back to 1950), the S&P 500 has declined for the year 20 times or 26% of the time. In other words, 74% of the time, the market as measured by the S&P 500 went up.
Jeff’s numbers show that in those last 76 years, 49 years showed a positive first 5-day percent change. Of those 49 years only 8 of those years went on to close down for the year. That’s an 84% bias for the year to close higher when we have a positive first 5-day percent change.
My (Larry William’s) add-on to Yale’s and Jeff’s work was to look at the years that gained 1.2% or more in the first 5 days of trading. Since this is only one week’s worth of trading, it may seem like a small number, but if repeated what would this number be collectively for the year? A very big number indeed! There were 28 such years of over 1.2%. Of those years, only 2 were down for the year. That’s a 93% bias for the year to close higher. What an improvement from the average 74%!
In 2026, the first 5-day** change for the Dow Jones 30 was +3%.
In 2026, the first 5-day** change for the S&P 500 was +1.6%.
Those 28 years had an average annual return of 14%. The remaining years had an annual gain of 5.3%
Being a guy that likes statistics that seem to go back a long ways, I find this something pretty good to refer to throughout the year. So now I want to get back into the meat and potatoes of this week’s note:
One of the biggest complaints that I have read about for years, since the helicopter drop of money on the economy post COVID was the debasement of the US Dollar. We completely disagree with fears of “debasement” and the end of American Exceptionalism. But two things did concern us last year.
- COVID stimulus – from easy money and irresponsible deficit spending – was wearing off. Historically, there was almost no way the US should have been able to lockdown the economy and never have a recession. So far, the main price was higher inflation and more inequality and that price has been paid by those with lower incomes. The overall economy has continued to grow, but as stimulus faded we expected things to slow more than they have.
- The fact that by any measure the stock market was over-valued. This was undeniably the complaint of virtually every analyst in the Barron’s Roundtable starting 2025 and continues to be the complaints this past week in the 2026 Roundtable.
So, what about 2026? First off, if anyone thinks they know exactly what will happen, they are kidding themselves. We woke up on January 3rd to the arrest of Nicolas Maduro, the self-proclaimed President of Venezuela. No one expected this, but it will have far-reaching effects on Russia, China, Cuba, the oil market, and global politics. Meanwhile, politics and geopolitics have, unfortunately, come roaring back into the picture to create some added uncertainty.
Friday came and went without the Supreme Court ruling on President Trump's tariffs. That might have been one reason stocks accelerated higher once the 10:00 am ET expected announcement never materialized. Reuters reports the highest court in the U.S. is now expected to issue its next rulings this week, which offers at least a couple days' reprieve. On top of that, though, there is also everything going on with Venezuela, not to mention the United States circling the proverbial waters around Greenland, launching a large-scale strike on ISIS in Syria, and an uprising in Iran in which the U.S. is on the verge of becoming more directly involved. All these events have created a lot of noise and headlines, without creating much associated market volatility.
One of the biggest things that I am concerned about as related to future 2026 market volatility is in November, the US will elect a new Congress which could have a massive impact on fiscal policy for years to come. The Federal Reserve will likely cut interest rates in 2026 – but with a new Fed leader coming in it could be more than that.
What we do know is that things will change. And many of those things will be positive for growth.
In addition, deregulation, the shrinking of the bureaucracy (January to November federal employment was down 271,000), and hundreds of billions of dollars in cuts to climate-related subsidies are removing wasteful spending and obstacles to productivity growth. And while it is still too early to say with conviction, the actions against Maduro in Venezuela are likely to begin a process of pushing back against captured global institutions.
A global elite, who stand for open borders and “reimagining” the economy and support things like the “Great Reset,” are now on notice. Undermining freedom one institution at a time with seemingly free reign is over. At least for now. We see this as a good thing. Why? Because any reasonable person, looking at the history of our world, realizes that the founding of the US was one of the greatest things to ever happen. Freedom reduces the power of authoritarians and dictators don’t like this, but freedom is the greatest generator of wealth. It seems we are getting more of it. Which is appropriate in our country’s 250th year.
One worrisome development is a significant economic slowdown in Europe. We won’t go into all of it, but Germany and the UK are having economic problems. The German economy contracted from April to September, while the UK economy grew just 0.1% in Q3 (0.4% annualized). Much of this weakness is in manufacturing as electricity prices have soared because of climate-change-related energy policy.
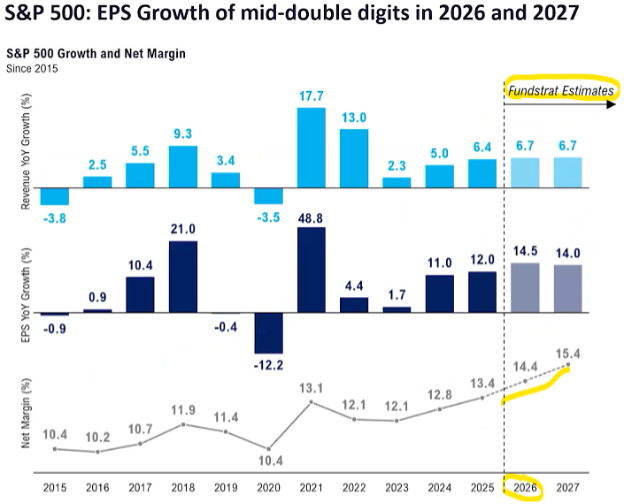
Besides the midterm elections in November, a major component that I feel underlies the reason for why a market could go up or down is corporate earnings. So, in looking at the prospective earnings for 2026, according to Thomas Lee of FundStrat, this is what the estimates are for 2026. You will note that not only have earnings been in a big upswing since 2023, but they are also expected to actually accelerate! So, even though the markets have been strong for three years in a row, they quite possibly should rise even more this year due to an earnings backdrop that clearly supports higher price levels:
A “sniff” at these earnings expectations could be to look at the market action internally after the finish of the third quarter earnings releases. In looking at December, which was a difficult month in general from the various swings in either direction without a clear directional statement being made, there were clear winners and losers. Does this portend what is going to be the case going forward? No one is to know. We can look at the political, economic and seasonal data, but until we get earnings and earnings projections for the fourth quarter we can’t be sure (or at best more confident). But all in all, here is what we have:
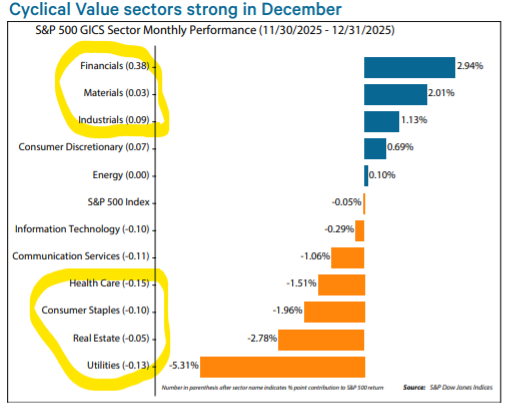
As I have highlighted, the bottom four have been laggards and continue to be. The tech group took a breather for the month, and Financials, Materials (metals), and Industrials carried the baton. I find it interesting and notable that Energy has begun to creep up, and this Venezuela issue could be a catalyst to it moving higher. Stay tuned!
One of the most important things to always pay attention to is interest rates and the direction of interest rates. This was an issue that was focused on by almost every member of the Barron’s Roundtable this past weekend. Their concern was primarily if 10-year interest rates rise above 4.5%. The basic reason is that mortgage rates are based off the 10-year Treasury. If your mortgage rate is lower, you have more money to spend because your mortgage payment is smaller. This means more money going to consumption, which is an underlying growth driver of the broad economy. In looking at a microcosm of what has happened since COVID, things went in this order:
- COVID hits the world.
- The world shuts down virtually everything.
- Global economies come to a screeching halt.
- Money is helicoptered onto the world to provide purchasing power due to shutdowns.
- Money is spent rigorously creating inflation.
- Interest rates are hiked once stabilization of economies happens and things begin going back to normal.
- Inflation is contained, and focus goes back to making sure growth is permitted.
- Slowdown needs to be addressed after numerous rate hikes.
- Interest rates cut systematically and slowly to measure effects and not overheat economies.
This can be seen in the chart below. We are still in an easing cycle. Due to the positive effects of AI, and the lower cost of capital, economic growth has been robust. This creates a quandary for policy makers. This is why they are taking inordinately longer periods of time to measure the effects of each and every cut, with Powell’s focus being on labor. This year could include a new policy from Trump and company to draw foreign labor pools back into the US. But this is something that cannot be handicapped. Here is the rate picture since COVID:
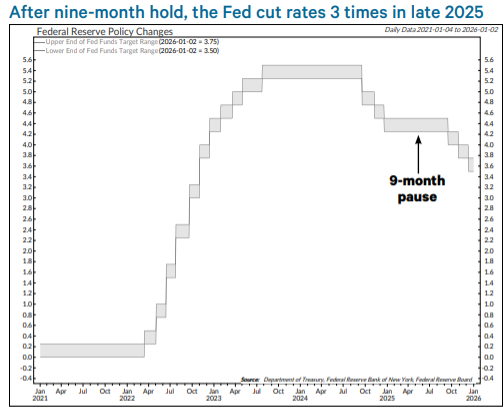
The cuts that started in late 2024 into 2025 and are said to be continuing in 2026 could be quite positive for the markets and the economy. What needs to be paid attention to is what is called “the slope of the yield curve.” What this means is that as long as short-term rates are lower than long-term rates it implies economic growth and continued prosperity. If these rates invert, where short-term rates are higher than long-term, it implies that rates need to be cut voraciously to reinvigorate the economy with cheaper money so business growth can be stimulated. At present, we have a very health “normal” yield curve where short-term rates are lower than longer-term.
Near-term Equity trends are bullish, and last week closed with a notable breakout in QQQ as two key components rebounded while Semiconductor and Semi-cap Equipment stocks showed tremendous strength. Homebuilders also rallied as the Administration has begun to take action to combat affordability concerns for housing. Given that a decision on tariffs is expected this week, I anticipate that any decision to roll back tariffs might have negative implications for the bond market as yields start to rally on the long end. Overall, January has gotten off to a good start with gains in the first five days of trading, along with broad-based strength from Equal-weighted SPX as both Healthcare and Transportation stocks broke out this past week.
I’ll give an update next week as to how things are playing out. Over the weekend Powell was challenged by the US Government, and Trump is demanding credit card companies to drop their interest expense to 10% from around 22%. Things continue to be interesting as usual!
In closing, I wanted to introduce you all to the latest member of Tower 68. Meet Jeff.

- Ken South, Tower 68 Financial Advisors, Newport Beach
-
Get Ken's Weekly Market Commentary Delivered To Your Inbox!
Important Disclosures:
The opinions voiced in this material are for general information only and are not intended to provide specific advice or recommendations for any individual. To determine which investment(s) may be appropriate for you, consult your financial professional prior to investing. All performance referenced is historical and is no guarantee of future results. All indices are unmanaged and cannot be invested into directly.
All information is believed to be from reliable sources; however LPL Financial makes no representation as to its completeness or accuracy.
Investing involves risks including possible loss of principal.
The Standard & Poor's 500 Index is a capitalization weighted index of 500 stocks designed to measure performance of the broad domestic economy through changes in the aggregate market value of 500 stocks representing all major industries. The S&P 500 is a stock market index tracking the stock performance of 500 of the largest companies listed on stock exchanges in the United States. Indexes are unmanaged and cannot be invested in directly.
The Dow Jones Industrial Average is comprised of 30 stocks that are major factors in their industries and widely held by individuals and institutional investors.
The Nasdaq-100 is a large-cap growth index. It includes 100 of the largest domestic and international non-financial companies listed on the Nasdaq Stock Market based on market capitalization.
The Russell 2000 Index is an unmanaged index generally representative of the 2,000 smallest companies in the Russell 3000 index, which represents approximately 10% of the total market capitalization of the Russell 3000 Index.
Data sourced from Bloomberg (2025).
Stock investing includes risks, including fluctuating prices and loss of principal.
Bonds are subject to market and interest rate risk if sold prior to maturity. Bond values will decline as interest rates rise. Bonds are subject to availability, change in price, call features and credit risk.
Government bonds are guaranteed by the US government as to the timely payment of principal and interest and, if held to maturity, offer a fixed rate of return and fixed principal value.
Bond yields are subject to change. Certain call or special redemption features may exist which could impact yield.
International investing involves special risks such as currency fluctuation and political instability and may not be suitable for all investors.
Alternative investments may not be suitable for all investors and should be considered as an investment for the risk capital portion of the investor’s portfolio. The strategies employed in the management of alternative investments may accelerate the velocity of potential losses.
This information is not intended to be a substitute for specific individualized tax advice. We suggest that you discuss your specific tax issues with a qualified tax advisor.
The economic forecasts set forth in this material may not develop as predicted and there can be no guarantee that strategies promoted will be successful.
LPL Tracking #848366