


For the year 2025 I have focused on:
- Economic growth of the US and Eurozone – with an emphasis on U.S. GDP
- Earnings, earnings, earnings – If the GDP is truly the fuel, the earnings are the engine
- US Dollar – since trade is heavily dependent on cross-border currency exchange the all-mighty dollar should be watched. Gold, oil, and crypto should be observed as well peripherally as they should be a manifestation of what the dollar is doing.
- Which markets are doing best? Equities? Bonds? US/ Foreign? Big/Small? Growth/Value?
- Which sectors are showing greatest relative strength?
- What “normally” happens in 1-year, 4-year, 10-year cycles?
- Statistically, if the US market has been doing “X” then what has happened afterwards in the past when “X” has been the action?
- What are the leading companies in the leading sectors?
This has been the mindset and roadmap that I have been using. I have recognized that the last 10 years of history has been a poor predictor when we are dealt a hand of cards as we have currently. Pick your issue as to the cards we are currently holding; mass liquidity, a couple of wars, President Trump, Immigration, Tariffs, falling interest rates. All are both meat & Potatoes and spice on the current market stew.
So where are we today?
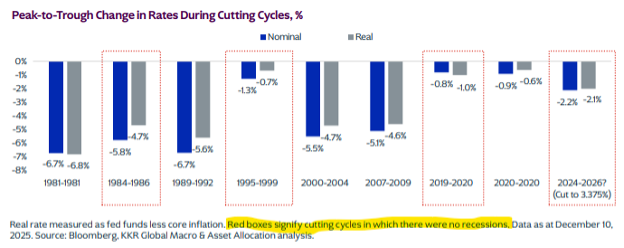
The US equity market’s year-end performance has continued to warrant attention. I’ve mentioned in previous notes that historically, the November-December stretch has been the best two-month period, with the world stock market index (both US and others combined) gaining a median of 3.75% since 1987. When the market has had a year-end rally consistent with the seasonal tendency and breadth has been healthy, as in November-December of 2022-2023 (when the Fed stopped raising rates and began inferring an easing cycle was to happen next), the implications have been bullish for the year ahead. See below the cycles of interest rate actions by the Fed. This was put together by KKR’s global research team and clearly exemplifies the importance of cyclical moves in interest rates:
As can be seen below, the rally in global stocks has gotten tired and as a result, the rally watch indicators are not showing strength- which would imply higher price levels in the immediate future:
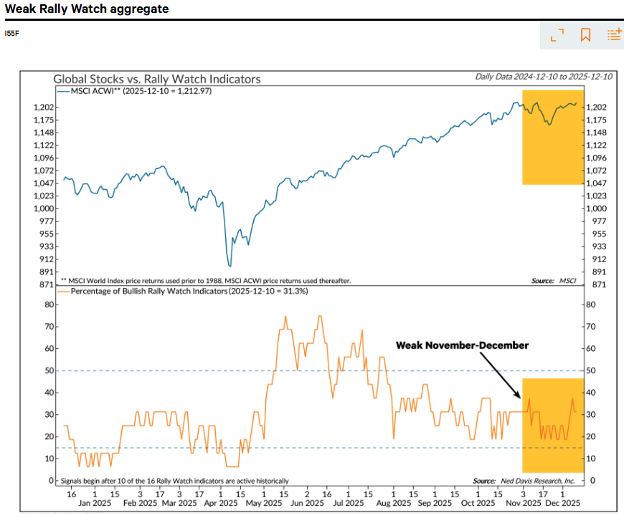
With time running out on the two-month period, the return is still negative. And among 13 breadth indicators in NDR’s Global Watch report, bullish readings are in the minority. They were in the majority during the year-end rallies of 2022 and 2023. This isn’t surprising as around October of 2022 the Fed began to fuel the economy once more by ratcheting down interest rates. Now, if I am to be a betting / guessing man, it seems to appear that after a quite stupendous rise since late 2022, the market’s leaders are simply a bit tired. There isn’t anything wrong (inflation, new wars, bad growth, spiraling unemployment, bad earnings forecasts) so this should be seen more of a pause to refresh rather than an end to the current market directional move.
Among other indicators, the percentage of the world markets’ stocks above their 50-day moving averages has maintained a pattern of lower highs and lower lows since August. This is sort of like a rocket going up but losing its velocity. The market is still rising, but not with the intensity (breadth) that you imply that it will continue in the short run. Again, this doesn’t mean that the longer-term market advance is over, but rather that it was in need of a well-deserved rest.
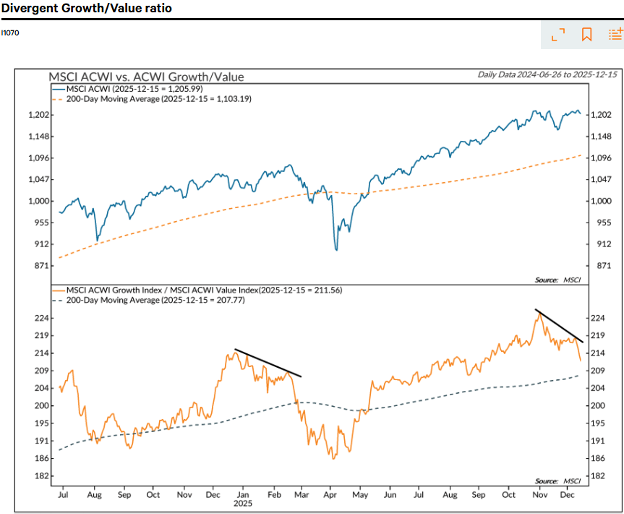
Along with this well-deserved rest, there could also be a situation where the large growth companies, often referred to as the Magnificent 7 (as they are all large technology companies) could take a breather and the stodgier value types such as the financials could get their day(s) in the sun. What is important about this point is that just because the growth part of the market is taking a breather, the rest of the market can carry the torch and push the markets to new and higher highs. This is exactly what is happening. See the chart below. Please notice in the top portion that the world markets are continuing their advance, but in the second portion, that under the hood, the baton has been passed from the Growth components to the Value components. How long will this happen? Until it is done happening. I believe that since the monetary environment is still very accommodative, and the earnings environment is still in a robust situation, that it could be simply a pause to refresh. If it something more, we will be prepared to act accordingly. Please take a moment and examine this chart. This is really quite important to understand:
So, here we sit. The weather has clearly changed in the markets, but not quite enough to represent a sea change. As always, I will keep you abreast of this and keep you up to date! If these divergences persist along with breadth divergences and a declining Magnificent 7, the prospect of greater decline warnings will increase. And if the U.S. enters a downtrend in absolute terms as well, the global trend will be weighed down by its 65% weight in the all-world index. That’s what happened during this year’s February-April market sell-off. You will notice that I often use the US equity markets as a proxy for the entire world stock markets combined. The reason for this, as I have stated just now, is that the US equity market makes up 65% of all equities of the world combined.
As I write this, the markets seem to be preparing for Santa after all. Strong moves in the markets since last Thursday have taken many indexes to once again higher highs. Since this week tends to be a low volume one as today is only a half day and Friday is expected to be quite light, giving to much attention to the market action might not be advisable.
Please, Please, have a wonderful Christmas and know that we will all be here next week to meet any year-end demands you might have.
- Ken South, Tower 68 Financial Advisors, Newport Beach
-
Get Ken's Weekly Market Commentary Delivered To Your Inbox!
Important Disclosures:
The opinions voiced in this material are for general information only and are not intended to provide specific advice or recommendations for any individual. To determine which investment(s) may be appropriate for you, consult your financial professional prior to investing. All performance referenced is historical and is no guarantee of future results. All indices are unmanaged and cannot be invested into directly.
All information is believed to be from reliable sources; however LPL Financial makes no representation as to its completeness or accuracy.
Investing involves risks including possible loss of principal.
The Standard & Poor's 500 Index is a capitalization weighted index of 500 stocks designed to measure performance of the broad domestic economy through changes in the aggregate market value of 500 stocks representing all major industries. The S&P 500 is a stock market index tracking the stock performance of 500 of the largest companies listed on stock exchanges in the United States. Indexes are unmanaged and cannot be invested in directly.
The Dow Jones Industrial Average is comprised of 30 stocks that are major factors in their industries and widely held by individuals and institutional investors.
The Nasdaq-100 is a large-cap growth index. It includes 100 of the largest domestic and international non-financial companies listed on the Nasdaq Stock Market based on market capitalization.
The Russell 2000 Index is an unmanaged index generally representative of the 2,000 smallest companies in the Russell 3000 index, which represents approximately 10% of the total market capitalization of the Russell 3000 Index.
Data sourced from Bloomberg (2025).
Stock investing includes risks, including fluctuating prices and loss of principal.
Bonds are subject to market and interest rate risk if sold prior to maturity. Bond values will decline as interest rates rise. Bonds are subject to availability, change in price, call features and credit risk.
Government bonds are guaranteed by the US government as to the timely payment of principal and interest and, if held to maturity, offer a fixed rate of return and fixed principal value.
Bond yields are subject to change. Certain call or special redemption features may exist which could impact yield.
International investing involves special risks such as currency fluctuation and political instability and may not be suitable for all investors.
Alternative investments may not be suitable for all investors and should be considered as an investment for the risk capital portion of the investor’s portfolio. The strategies employed in the management of alternative investments may accelerate the velocity of potential losses.
This information is not intended to be a substitute for specific individualized tax advice. We suggest that you discuss your specific tax issues with a qualified tax advisor.
The economic forecasts set forth in this material may not develop as predicted and there can be no guarantee that strategies promoted will be successful.
LPL Tracking #840852