


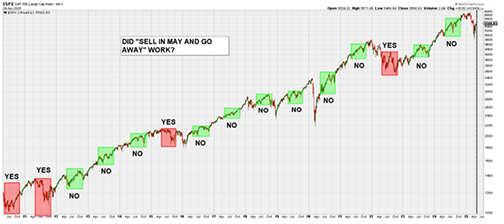
It is time for my annual reminder that we should not make market decisions based solely on catchy rhymes. “Sell in May and go away” is a common phrase around this time of year, and stems from the fact that, historically, the returns in the stock market from May through October have not been as good as from November through April. As history would have it, the reason often sighted was that the Wall Street elite would leave for the Hamptons in late May or June when kids got out of school for the summer and then return in late September and get back to the grind into year end.
However, in recent years doing so would have ended up costing you money, a reminder that historical tendencies are not set in stone. Looking back over the past 15 years, I’d (subjectively) say that selling in May would have been a good decision only four times and 2010 is questionable since the market ended higher but did go noticeably lower at first. There might be very good reasons to sell right now given that the markets have been very strong off the April 7th lows and may be primed for a retest lower, but entering the month of May and looking at the earnings reports and various economic reports selling this May should not be high up on the list. Here is a very simple chart of past May-October periods boxed on a chart of the S&P 500 going back to 2010:
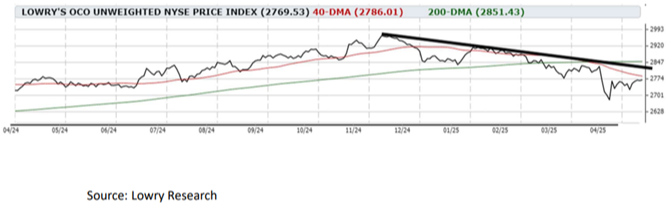
The Average NYSE Stock Did Not Fall as Much but Has Not Rallied As Much During The Past Rally
Lowry Research's Unweighted Operating Company Only NYSE Price Index is one of my go-to measures of the general stock market. A really long name, but truly something not observed by many. I use it in my work as it does not give an oversized vote to the big companies in the S&P 500. Instead, it gives all of them an equal vote. Consequently, it's not going to be as skewed by the major stocks at the top of the market and also filters out most of the unnecessary "zombie" companies that aren’t true going concerns. As can be seen below, it topped out on November 25 and ultimately fell about 9.5% from that level into its low earlier this month. Part of why I use it is that it topped in November, where the widely followed S&P 500 didn't until months later in February. It has now recovered some of that loss, but not as much as you might expect. It is only about 2.5% above its April low and has remained in a clear downtrend since late last year. This tells me that after a painful pullback, we are going to need more information, and positive price moves to suggest that a new sustainable uptrend has begun.
Five signs of a valid bottom on April 7th:
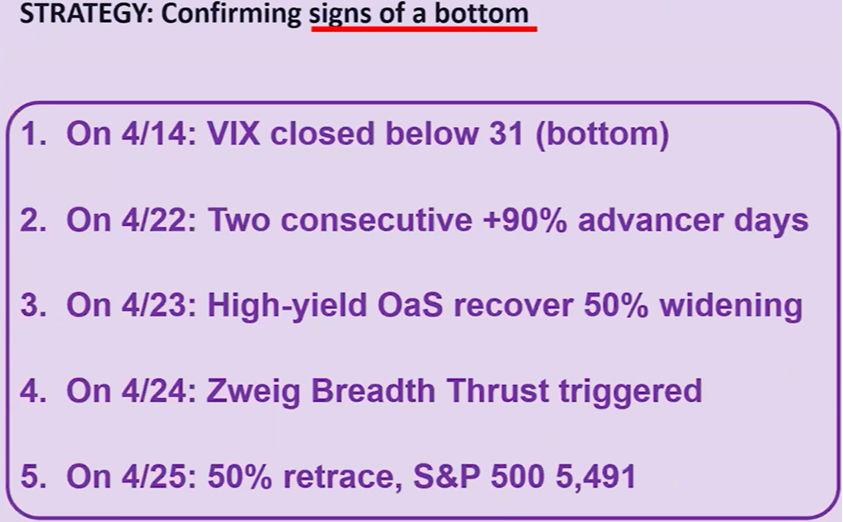
- VIX under 31 after going above 50. Tends to show that above 50 and then back to normalcy shows washed out fear gauge.
- Two consecutive days over 90% advance days. I went over this in last week’s newsletter.
- High yield interest rates are not spreading to a higher level vs. US Treasury debt. Therefore, the continued fear in the bond markets is abating.
- Zweig Breadth Thrust. I went over this in last week’s newsletter as well.
- The market has handily eclipsed the 50% bounce off of the lows. I believe based on some tariff deals already being done, but also very good earnings reports, particularly from market leaders.
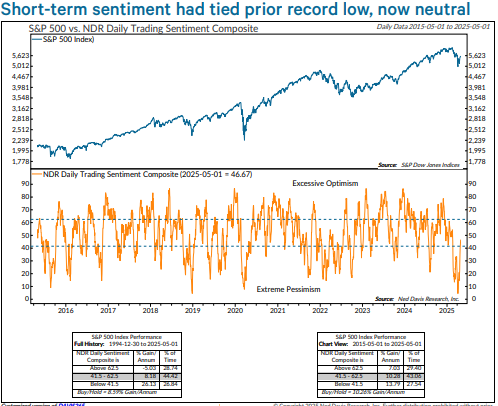
Looking at Ned Davis research studies, The NDR Daily Trading Sentiment Composite tied with its record-low of 4.4% on April 7 and 8. The only prior case of it falling this low was in December 2018. This shows an emotional low from a comparative standpoint as opposed to a true economic reason for a low.
Taking all of this into consideration, there are now basically four issues (besides price moves) that I am focused on:
- Tariffs- When, who, how much, and how long to come to a measurable conclusion.
- Recession- Is there really any "there" there? At present maybe companies and consumers took action in front of the tariff period to be prepared as possible that is screwing things.
- Earnings- how are companies doing for the first quarter and how positive or negative are they in forecasting the next few?
- Current Markets- the activity of markets coming out of the dreadful first quarter of a new presidential term, and how we look in the current snapshot seem to coincide and be quite telling.
Tariffs
The data may worsen before it gets better, as measured by a lack of daily input on the progress of the negotiations, but don’t rest on a seldom used negotiating tactic.
- Tariff effects are extremely idiosyncratic across sectors, industries and firms – varying dramatically based on product, business model and supply chain architecture. Therefore, to try and handicap the overall economic effect is really quite difficult, particularly when President Trump is not showing his hand in the negotiation.
- But the one persistent theme is that US businesses have a long and proven track record of resilience and ingenuity. Jim Cramer, in his Mad Money show last week interviewed the chairman of Dover corporation. In the interview the chairman brought us that he called a management meeting in early April, in front of the tariff announcement. He said that they adjusted their revenue forecast by 1% only. US companies simply figure out how to figure it out.
- As we’ve long said, once firms know the rules, they can adjust and continue on their way to generating profits. Just as the Dover chairman had stated, if they know where the boundaries are, they will know what should be done to maximize efficiencies and profitability.
- We have little reason to believe that won’t be the case again, whether the destination is an income statement recession, anemic growth, or more benign cooling.
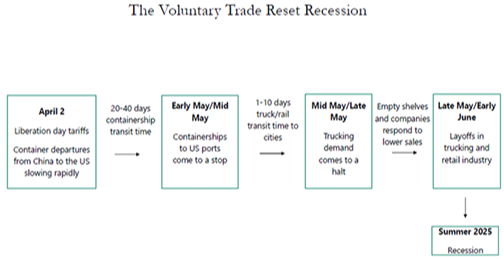
Recession
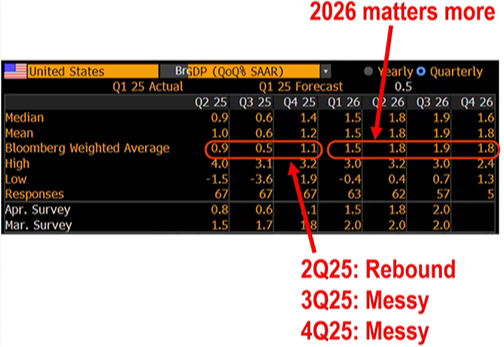
Noise about tariffs, business uncertainty, a constitutional fight, and a drop in stock prices had already created fear of a recession. When real GDP declined in the first quarter of 2025, some started to question if a recession is already here. Let’s take a deep breath and consider the facts. Yes, real GDP dipped at a -0.3% annual rate in Q1, the first decline for any quarter since 2022. But the main reason was that trade with other countries accounted for the largest drag on the economy for any quarter since at least 1947, as both consumers and companies loaded up on goods from abroad before higher tariffs kicked in. Since GDP is designed to measure domestic production, imports are subtracted even though Americans buy them because they were produced abroad. We aren’t saying GDP is a flawed statistic, we are saying it needs to be viewed correctly.
Real (inflation-adjusted) consumer spending increased at a moderate 1.8% annual rate in the first quarter and real business investment in equipment spiked up at a 22.5% annual rate, neither of which looks recessionary. We like to track “core” GDP, which is consumer spending, business fixed investment, and home building, but excludes the most volatile categories like government purchases, inventories, and international trade. Core GDP grew at a 3.0% annual rate in Q1, exactly matching the growth rate of the past year.
So, GDP was not the signal that the headline number suggested. In fact, when it was released, initially stocks went down only to recover as calmer heads prevailed. Nonfarm payrolls rose 177,000 last month and are up 144,000 per month so far this year. And the mix of jobs is much more positive. In 2023-24, 73% of the increase in payrolls were government, education, health care, and social services jobs. These jobs are largely driven by government spending policies, especially deficit spending. In the past three months, that share has dropped to slightly less than half. In other words, less of the recent job growth is due to government spending expansion.
Another signal that the US wasn’t in recession in the first quarter was that industrial production was up at a 5.4% annual rate while manufacturing rose at a 5.1% annual rate.
Instead, the slippage in real GDP reminds us of the decline in early 2022, when many analysts and investors (as well as conservative political commentators) were quick to declare a recession even though the decline in GDP, like in Q1 this year, was driven by one-off factors like inventories and trade, while the job market and industrial production kept growing.
Nonetheless, while we don’t think the data show a recession yet, the odds of a recession starting in the next year or so are still higher than normal. We estimate in the range of 40 – 50%. Why is the recession risk higher than normal? For one thing, we have yet to fully feel the effects of the tightening of monetary policy in 2022-23 – with both a drop in the M2 measure of the money supply as well as higher short-term interest rates. The bottom line is that it’s unlikely a recession has started yet, but investors should remain alert.

Earnings
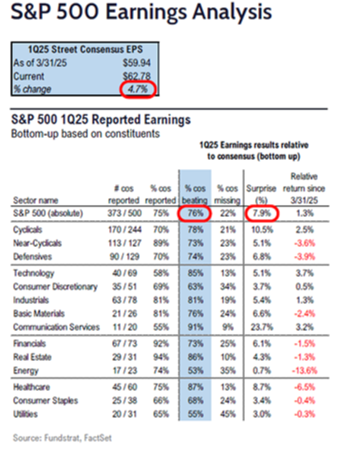
So far, as of Monday of this week, 373 companies (75% of the S&P 500) have declared earnings. Another 92 will report by the end of this week. Overall, 76% are beating estimates, and those that “beat” are beating by a median of 6%. Since this is looking into the past, the action of prices is more indicative of how the earnings came out relative to expectations, but even more about what the companies are saying about what they are “expecting” to do going forward. This quarter I feel that these forecasts are particularly important as companies are sort of being given a Mulligan to be able to forecast overly conservatively given the Tariff Tussle and recession fears. Since the markets logged a record setting 9 days straight of index price increases, this clearly shows both individuals and institutions voting with their wallets expecting things are going to continue progressing positively.
I feel that one of the best measures of earnings progression and forward guidance is how consumers are feeling about their jobs and therefore their ability to consume in the future. Strangely enough, consumers are very worried about losing their jobs. As seen in the chart below, they are dramatically more concerned now than they were during the COVID shutdown, and even more strangely more concerned than they were during the structurally devastating Great Financial Crisis.
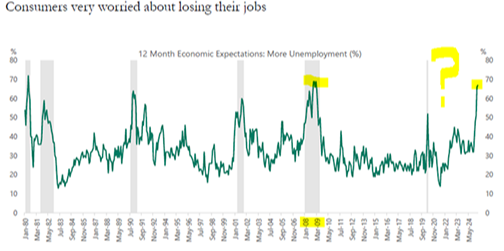
It makes one wonder if the public surveys of consumer attitudes are more dependent on the veracity of the media negativity, then they truly are on their ability to spend. I believe that we are dealing with a possibly loaded gun getting ready to fire.
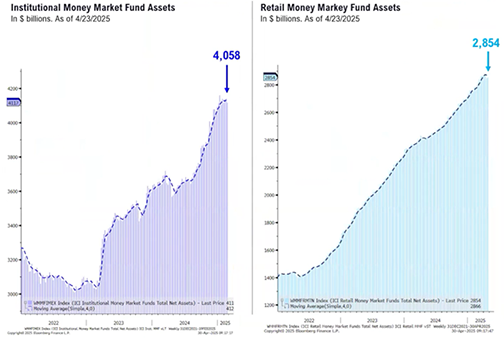
I keep coming back to the concept of available capital. I could go into mortgage delinquency, margin debt, and credit card debt, but seeing how the amount of capital that is available at the institutional level and the retail money market fund balances is a more accurate measure of the fire power that is building up for future purchasing. This is where we are currently:
Current Markets
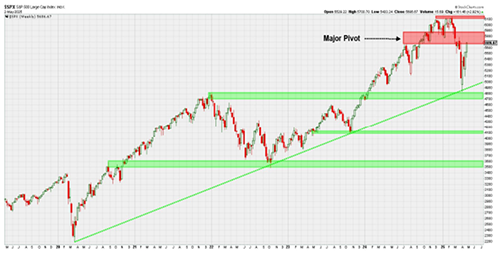
In the last few weeks, I have taken a lot of time to illustrate the extreme levels that the current market has gone to and in the last two weeks seem to have partially recovered from. I cannot say that this is a bounce off the lows that is going to ignore the fact that the correction from February to April was real and it is ready to go to new highs. I cannot say either that the market has bounced and that it is now prepared to go back down and continue in a correction phase until the first three points mentioned above are done. Here is the picture of exactly what the market has done. I have labeled the current level as a "Major Pivot" point. I say this because a bounce is just a bounce until it erases the damage that has been done. Now the going get a bit tougher. The market is within a few percent of the old highs, and now investors must decide whether tariffs, recession, earnings, and whatever else is lurking out there are enough to not allow prices to rally further. See the picture below:
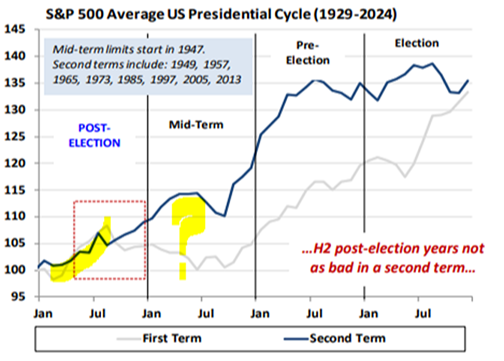
Last, I wanted to give an update to the Presidential Election Cycle. I have overlaid first term presidents with second term presidents for comparison’s sake. I did this because it could be argued that President Trump is a second term president- with another President sandwiched in between. As can be seen, in both cases, going back to 1929, the period after the first quarter has been quite strong and that difficulties begin sometime in the third quarter. This is when the first term and the second term begin to act quite differently. Still, they both recovered quite nicely in the "Sell in May" period.
In closing, I want to ask you all to read the Wall Street Journal Op Ed by current US Treasury Secretary Scott Bessent, that was in Monday's Journal. It was titled, "Trump's Three Steps to Economic Growth." I find this a very interesting article as it is not aligned with current media opinion and seems to articulate a roadmap for what could be a robust US economy. Please make the time to read this.
- Ken South, Tower 68 Financial Advisors, Newport Beach
-
Get Ken's Weekly Market Commentary Delivered To Your Inbox!
Important Disclosures:
The opinions voiced in this material are for general information only and are not intended to provide specific advice or recommendations for any individual. To determine which investment(s) may be appropriate for you, consult your financial professional prior to investing. All performance referenced is historical and is no guarantee of future results. All indices are unmanaged and cannot be invested into directly.
All information is believed to be from reliable sources; however LPL Financial makes no representation as to its completeness or accuracy.
Investing involves risks including possible loss of principal.
The Standard & Poor's 500 Index is a capitalization weighted index of 500 stocks designed to measure performance of the broad domestic economy through changes in the aggregate market value of 500 stocks representing all major industries.
The Dow Jones Industrial Average is comprised of 30 stocks that are major factors in their industries and widely held by individuals and institutional investors.
The Nasdaq-100 is a large-cap growth index. It includes 100 of the largest domestic and international non-financial companies listed on the Nasdaq Stock Market based on market capitalization.
The Russell 2000 Index is an unmanaged index generally representative of the 2,000 smallest companies in the Russell 3000 index, which represents approximately 10% of the total market capitalization of the Russell 3000 Index.
This information is not intended to be a substitute for specific individualized tax advice. We suggest that you discuss your specific tax issues with a qualified tax advisor.