


This is the week of Independence Day. In honor of this holiday and our God given virtues, we have put in a photo of most of the Tower 68 crew. Notice the hats that we picked up at Beach Cities church this last weekend. The hat emphasizes, “God Bless America” and Psalm 33:12. Please take a moment and read this Psalm. It is truer today than ever.

Every week I try to point out; it’s not the news that counts, it’s the market’s reaction to the news—and what’s interesting is that, unlike the wild volatility seen earlier this year on the tariff/negotiation headlines, the market continued its quiet, calm action even as the Middle East and oil prices flared up. That fits into one of our main thoughts as we wrap up a volatile, news-driven first half of 2025: That the past six months (really going back to December) look like one big setup for the market. Also, the undeniable fact that the first quarter of the first term of first year presidents ALWAYS has a tough time of it. Every time for a different reason, but every time it has been the case. I have put in this graph numerous times in my weekly commentary, but I believe that providing it again is of great value for a backdrop of where we are currently.
Another point to consider is that in the first quarter of a new administration, the equity markets tend to really have a tough time. As can be seen in the chart below, I have overlayed the 2025 market on top of the average market for every first year going all the way back to 1928. January seems to be a bit of a honeymoon, February is when the new president tends to shake things up, March is a settling of the shake up, and the first half tends to then be quite strong. Note, the yellow arrow pointing to where we are today:
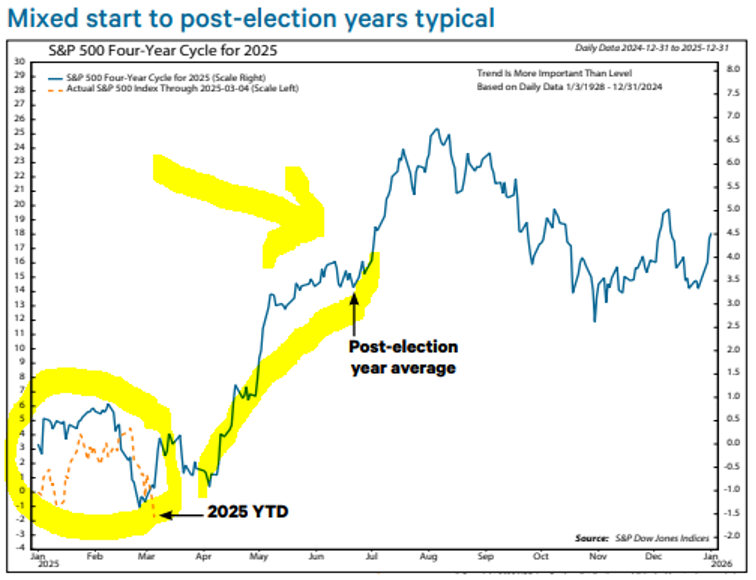
Another important point is that this chart above not only reflects a known historical consistency, but it also illustrates what could happen next, a time when the market might extend on a very strong run higher beginning at the start of the third quarter. After a couple of very good years (the major indexes did great in both 2023 and 2024, while growth stocks enjoyed a big 15-month run), the market usually needs some sort of reset to hike the fear level and reload the cannon of buying pressures. This was a perfect reason that was consistent enough to really allow investors, both domestic and abroad, both institutional and individual to sink their teeth into.
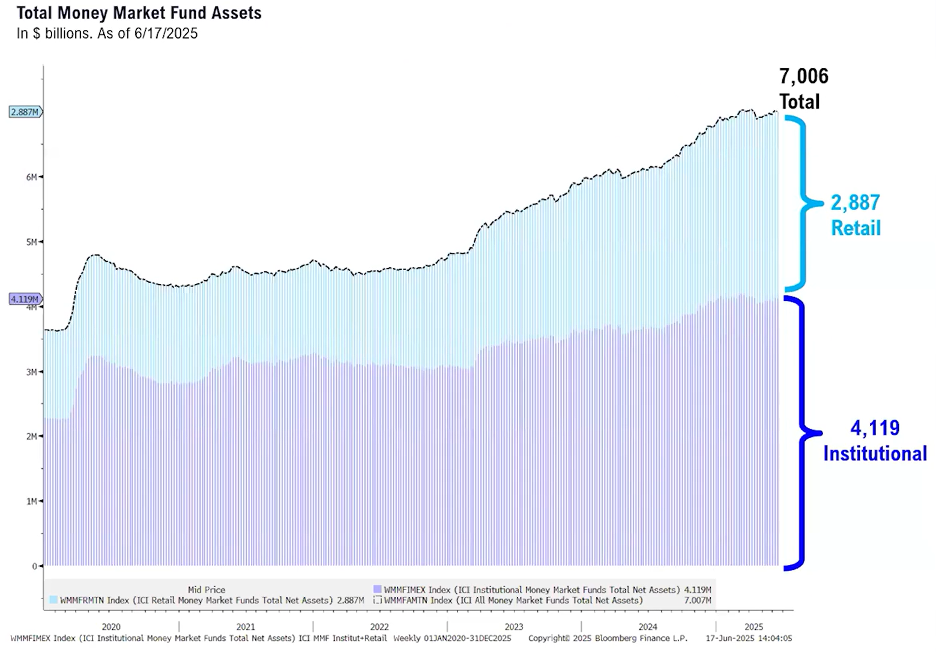
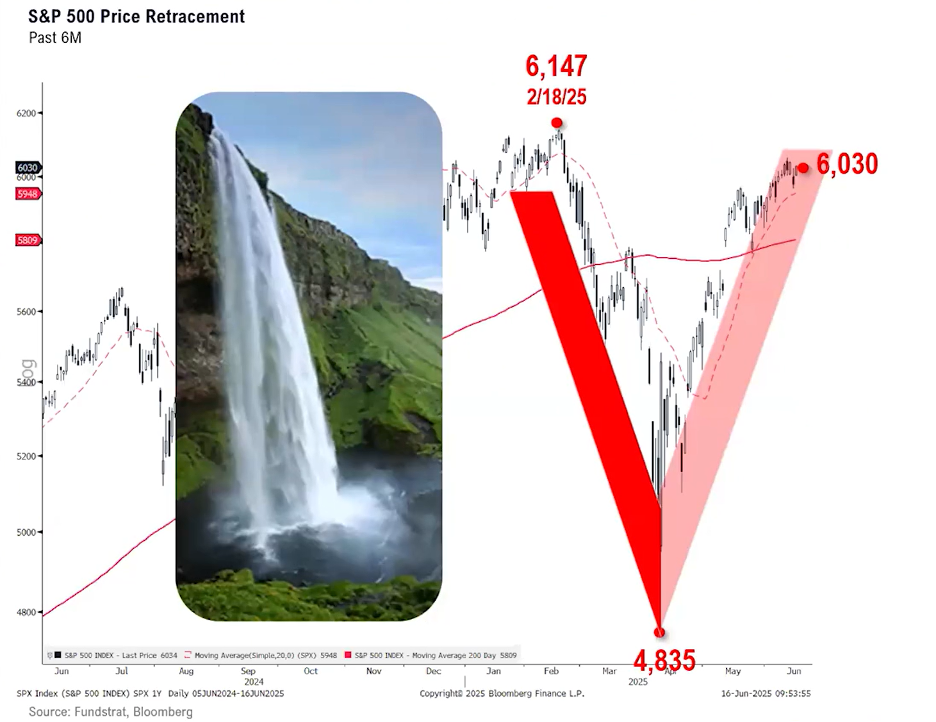
Sometimes markets can re-engage after months of listlessness, rather than outright decline, but this time, we think that the past six months of topping, plunging, rallying back and, recently, tightening up, have been about. Who knew the US-Iran-Israeli conflict, Trump's aggressive tariffs, a hawkish Federal Reserve, and the underperformance by the Magnificent Seven would push the stock market back toward record highs? As our past reports have been saying, global liquidity, that's who. And when I say “global” liquidity, I primarily mean domestic cash still sloshing around in short-term highly liquid assets, looking for a home. I have been very surprised that this factoid has not been mentioned in the financial press as it is sure to provide a huge source of capital for investment if opportunities are thought to exist. As of June 17th, this is where it is:
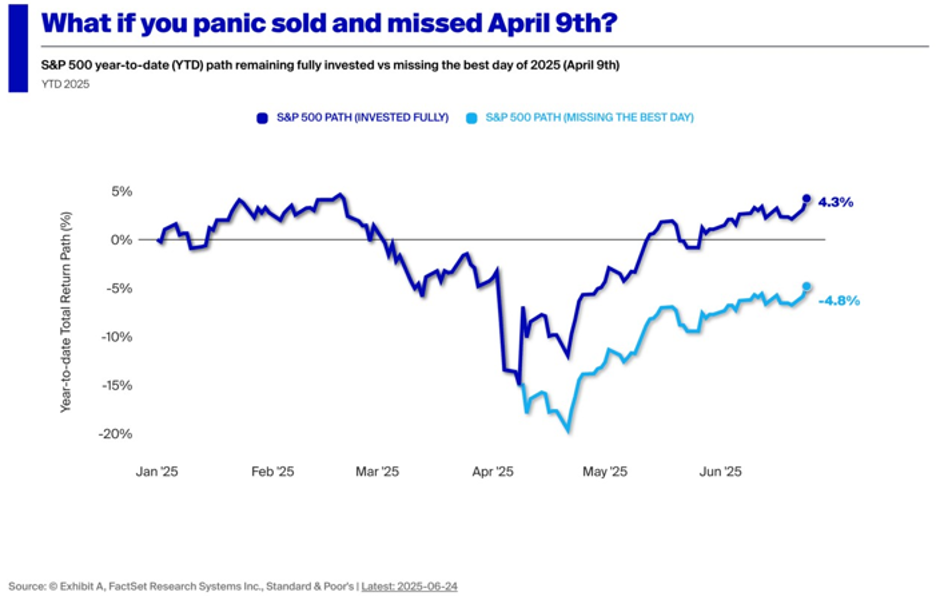
Since the April 8th low, the rebound has been so sharp that investors who sold during President Trump’s shocking initial tariffs revision on April 9 have missed out in a big way.
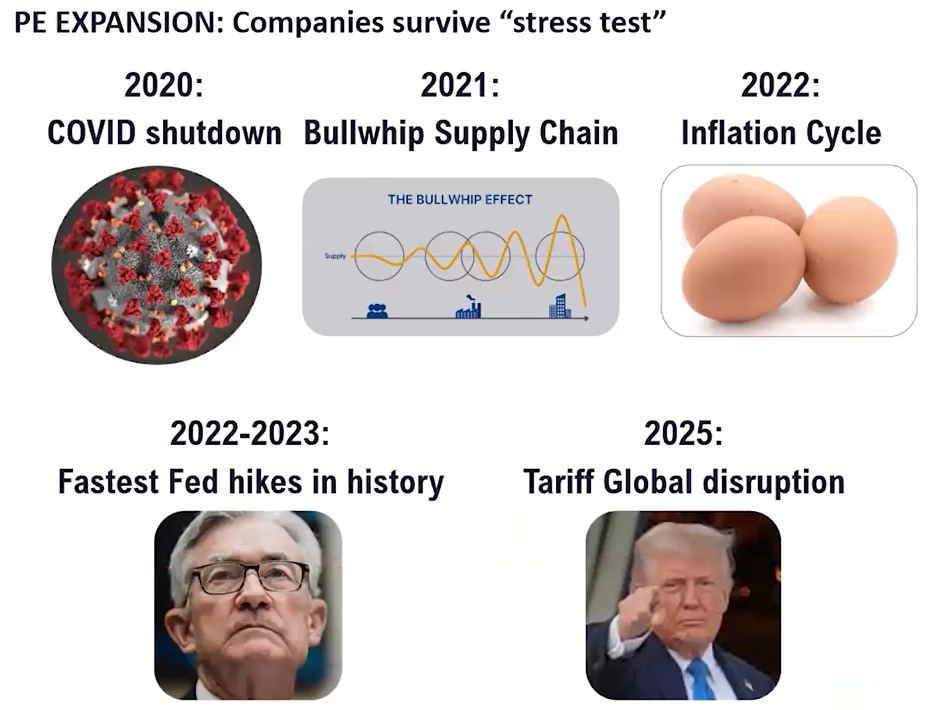
Thus, the bullish overall setup is there, and we remain very optimistic that the market as a whole is on track for plenty of upside when looking out for many months. Still, there’s been very little abnormal action (bad breakdowns), so the question has been when the buyers will start to really flex their muscle—and while it hasn’t been overly decisive and there’s still some selling on strength out there, the good news is we saw some fresh strength this week, with more than a few names we watch or own coming under accumulation. I often like to take this thought and put it in perspective of past situations that the markets have digested and moved forward from since COVID.
Unless there was a recession, there was always a V-shaped recovery in the markets as I stated last month. There needs to be something structurally wrong for the markets to truly reflect in a major decline. Feels almost like a new Bull Market than a late cycle. The investment outlook is better today than it was in February (at the old highs). The big bugaboo is tariffs, and visibility is much greater now. The markets have now survived their 5th major “Stress Test.”
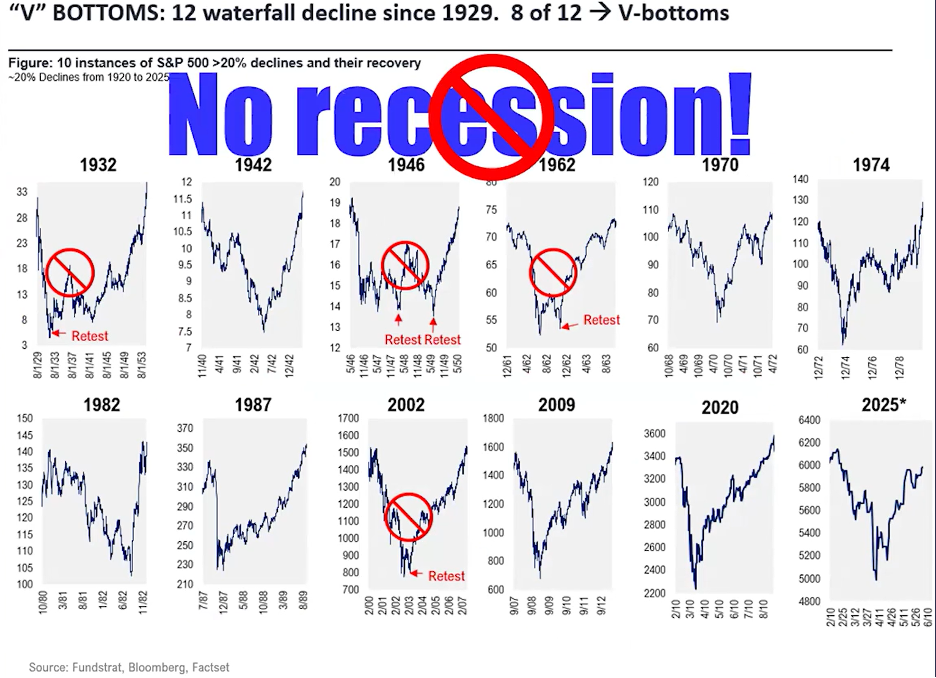
There have been eight times that the S&P 500 has had similar corrections as it has since the 15-20% April of this year. This recovery has been the strongest of all eight. I believe that the reason why the advance was so strong and so sharp is that the reason for the initial decline was a combination of a typical calendar event in the first quarter of the first year of a new Presidential term coupled / catalyzed by an exogenous event of tariff scares. Since it was not precipitated by an economic decline, an inflation shock, a growth decline, or drastic interest rate hikes, it has had no effect on first quarter earnings or the expectations for second quarter earnings.
It is becoming apparent that the next upleg will likely depend on the trajectory of earnings, the economy, tariffs, inflation, and Fed policy. From a technical perspective, the breadth, that was my concerns that I stated last week are seeming to alleviate themselves as we are seeing different sectors, namely financials, consumer discretionary, and industrials now joining the advance. THIS IS TREMENDOUSLY IMPORTANT. Also, the smaller company index, the Russell 2000, is climbing back on its horse. This is a statement to resilience and continuation of strength revitalization in the smaller company space.
With much of the news focused on Middle East developments, market volatility, and the Fed, Q1 earnings season never took center stage. Now that some of the dust appears to be settling, we take a closer look at the results, focusing on sector and company-specific drivers, revision trends, and key factors for earnings heading into the second half of the year. The four sectors with the highest Q1 beat rates were Health Care (93.3%), Communication Services (90.5%), Technology (89.6%), and Industrials (85.3%). In contrast, Utilities (58.1%), Real Estate (64.5%), and Energy (68.2%), the sectors with the lowest beat rate higher in Q1 than prior two quarters rates, also have much smaller weightings and less influence on the broad index. Rising concentration and Growth-sector dominance within the S&P 500 has left the index increasingly reliant on a handful of mega-cap names and industries to deliver growth. The dynamic has amplified the importance of sector-level earnings trends, as well as the potential risk if the mega-caps and Growth sectors fail to live up to expectations.
Looking forward to the second quarter’s earnings, those showing expected contributions to 2025 earnings growth for the quarter are as follows below. Of the 7.1% of earnings growth expected from the S&P 500, Technology accounts for 4.1% points, making it the most important sector for earnings this year by a wide margin. Health Care, Communication Services, and Financials follow as the only other meaningful drivers of growth. Note that Energy, Consumer Discretionary, Consumer Staples, and Real Estate are excluded, as all four sectors are expected to see earnings contract in 2025. This is our expectation based on the forecasts that were provided by the index constituents at their announcement of Q1 earnings.
So, this is where we are sitting currently, as of last Friday. Since last Friday the numbers have gotten even better, so much better in fact the market keeps pushing the ceiling to new highs.
Going back to 1929, and looking at every V-bottom, it can be seen that the only time that a V-bottom did not occur from a waterfall decline, there needed to be a recession present. Not only is the market saying that there is no recession present, but the Fed has remained stubborn in their further loosening of interest rates since there are no economic data points to support a continuation of rate cutting. Here is a picture of all 12 V-bottoms, with an indication of which ones were accompanied by a recession.
So, what is really going on then? Markets are at new all-time highs, and yet there seems to be no fireworks at all. I basically see the following as major reasons why many are not only in disbelief, but also if they were to change there could be a serious acceleration to the upside:
- Non-US Investors are not bullish because they have Trump Derangement Syndrome. This is tough to quantify other than the action of the US Dollar and the movement from US equities into World (ex. US) equities. As I mentioned last week, the S&P vs. the World (ex. US) is starting to show the US developing a head of steam once again. If these foreign investors should jump back on the US band wagon this could be additional fire power to the $7.2 Trillion mentioned above.
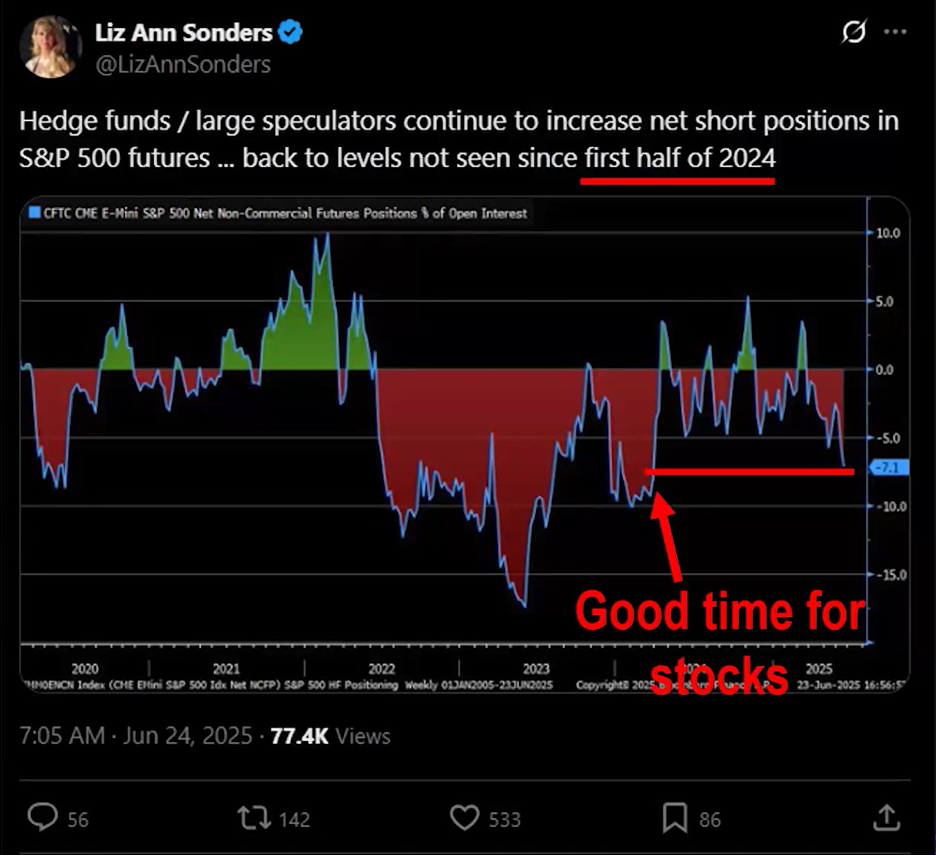
- Institutional investors are not only not bullish, but they are actually shorting stocks. They are even adding to their shorts on a weekly basis. If they were to reverse this, a short-squeeze could result and there would be another block of purchasing, sending markets higher.
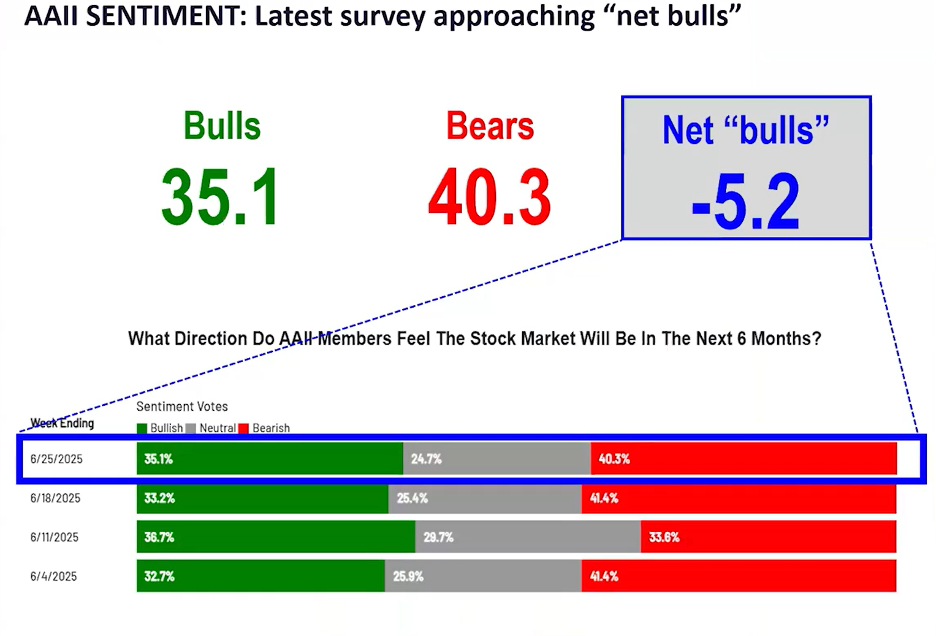
- High net worth investors are not even bullish. This was validated in the AAII (American Association of Individual Investor) sentiment poll survey for this last week. There are still more bears than bulls in High-Net-Worth Land.

In closing, even veteran economist David Rosenberg, who typically leans bearish, said the technical set up has also improved in recent weeks, supporting a “spring-summer rally.”
“While this cannot exactly be described as a rally based on the fundamentals,” Rosenberg said, “the technical picture has improved considerably as the gaps get filled with ease and the cumulative daily advance-decline lines for both the NYSE all-issue composite and the S&P 500 make fresh all-time highs.”
Nevertheless, valuations remain stretched near levels seen at the peak of the dot-com bubble, based on forward-earnings estimates but history shows that overvalued leading names often become even more overvalued, especially during bull markets. Further, AI’s exponential growth is doubling every 3 1/2 months in processing power so it continues to be underestimated despite the hype, plus AI is rendering debt-based business models obsolete. AI-driven companies like OpenAI and Anthropic achieved massive valuations without borrowing, a shift from historical norms where debt fueled scalability such as in shipping and railroads. Finally, historical data shows that buying stocks at all-time highs can generate slightly better returns versus buying at any other time.
- Ken South, Tower 68 Financial Advisors, Newport Beach
-
Get Ken's Weekly Market Commentary Delivered To Your Inbox!
Important Disclosures:
The opinions voiced in this material are for general information only and are not intended to provide specific advice or recommendations for any individual. To determine which investment(s) may be appropriate for you, consult your financial professional prior to investing. All performance referenced is historical and is no guarantee of future results. All indices are unmanaged and cannot be invested into directly.
All information is believed to be from reliable sources; however LPL Financial makes no representation as to its completeness or accuracy.
Investing involves risks including possible loss of principal.
The Standard & Poor's 500 Index is a capitalization weighted index of 500 stocks designed to measure performance of the broad domestic economy through changes in the aggregate market value of 500 stocks representing all major industries. The S&P 500 is a stock market index tracking the stock performance of 500 of the largest companies listed on stock exchanges in the United States. Indexes are unmanaged and cannot be invested in directly.
The Dow Jones Industrial Average is comprised of 30 stocks that are major factors in their industries and widely held by individuals and institutional investors.
The Nasdaq-100 is a large-cap growth index. It includes 100 of the largest domestic and international non-financial companies listed on the Nasdaq Stock Market based on market capitalization.
The Russell 2000 Index is an unmanaged index generally representative of the 2,000 smallest companies in the Russell 3000 index, which represents approximately 10% of the total market capitalization of the Russell 3000 Index.
Data sourced from Bloomberg (2025).
Stock investing includes risks, including fluctuating prices and loss of principal.
Bonds are subject to market and interest rate risk if sold prior to maturity. Bond values will decline as interest rates rise. Bonds are subject to availability, change in price, call features and credit risk.
Government bonds are guaranteed by the US government as to the timely payment of principal and interest and, if held to maturity, offer a fixed rate of return and fixed principal value.
Bond yields are subject to change. Certain call or special redemption features may exist which could impact yield.
International investing involves special risks such as currency fluctuation and political instability and may not be suitable for all investors.
Alternative investments may not be suitable for all investors and should be considered as an investment for the risk capital portion of the investor’s portfolio. The strategies employed in the management of alternative investments may accelerate the velocity of potential losses.
This information is not intended to be a substitute for specific individualized tax advice. We suggest that you discuss your specific tax issues with a qualified tax advisor.