


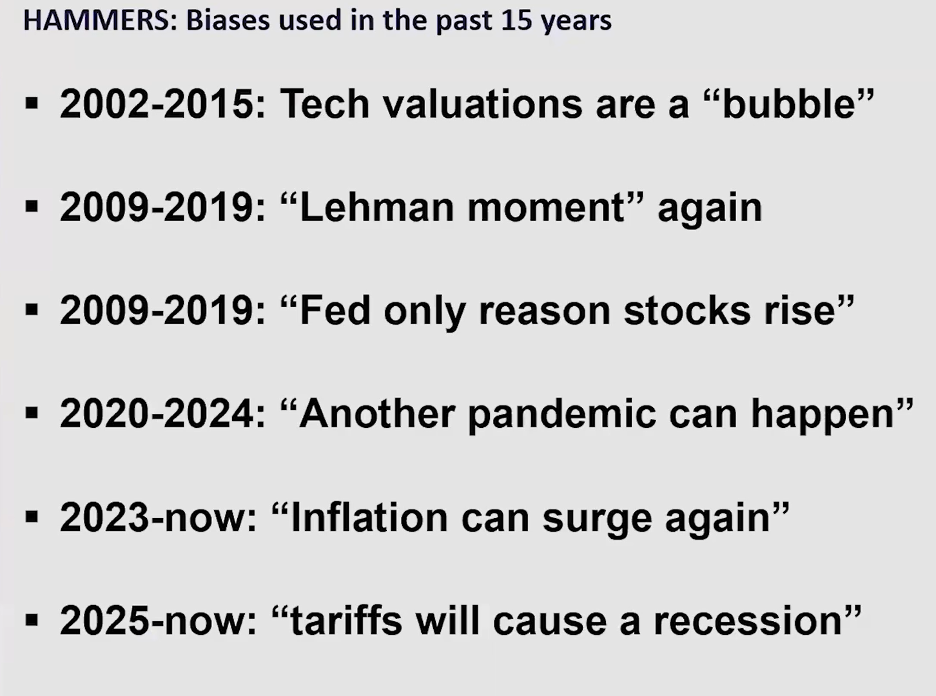
It is said that when running around with a hammer, everything looks like a nail. This is sort of what it seems like in the stock market today. Instead of the public and the media being ebullient about the progress made in US equity prices this year, instead all are seeming to be finding reasons why this is “bubble” and is doomed for eventual disaster. Going back 15 years, this is what have been major reasons for disaster. I bring this up as last Friday’s price action was a new high for many index measures and clearly a sign of health in US industry:
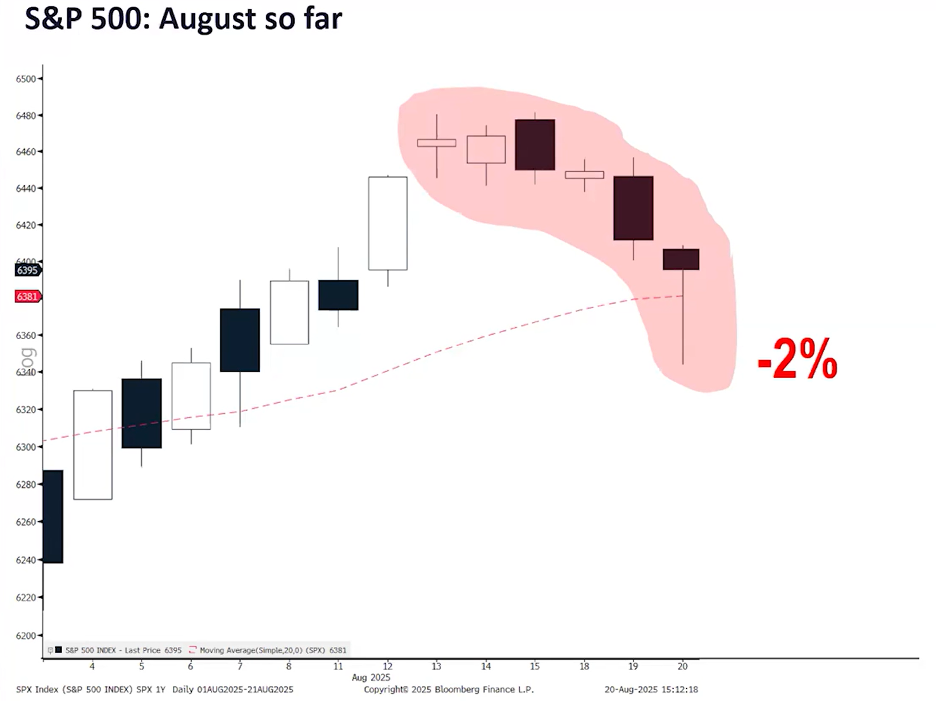
Beginning a little better than a week ago, the feared and telegraphed August / September negative period had appeared to be starting. Last week consistently saw this and most aggressively in the price action of the large technology stocks which have led the markets higher for a few years now. Taking a snapshot of the month of August, prior to last Friday’s blastoff, here is what it looked like:
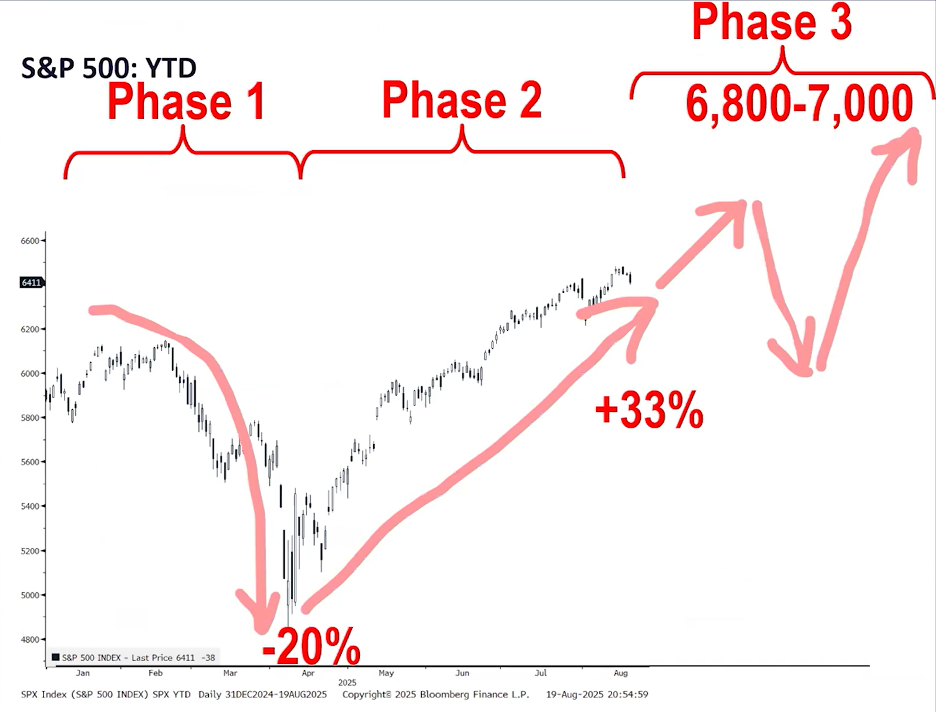
Friday of last week was a clear indication that if things aren’t broken, trying to get cute and pick a low is a difficult task indeed as this small sell-off was reversed in quick order. Thomas Lee of FundStrat last week made a projection of what he expects for the remainder of the year. Note the short-term decline that he is expecting before the final push into year-end. Also note that this rough estimate of slight decline dovetails with the August/ September tough period that I mentioned in last week’s note.
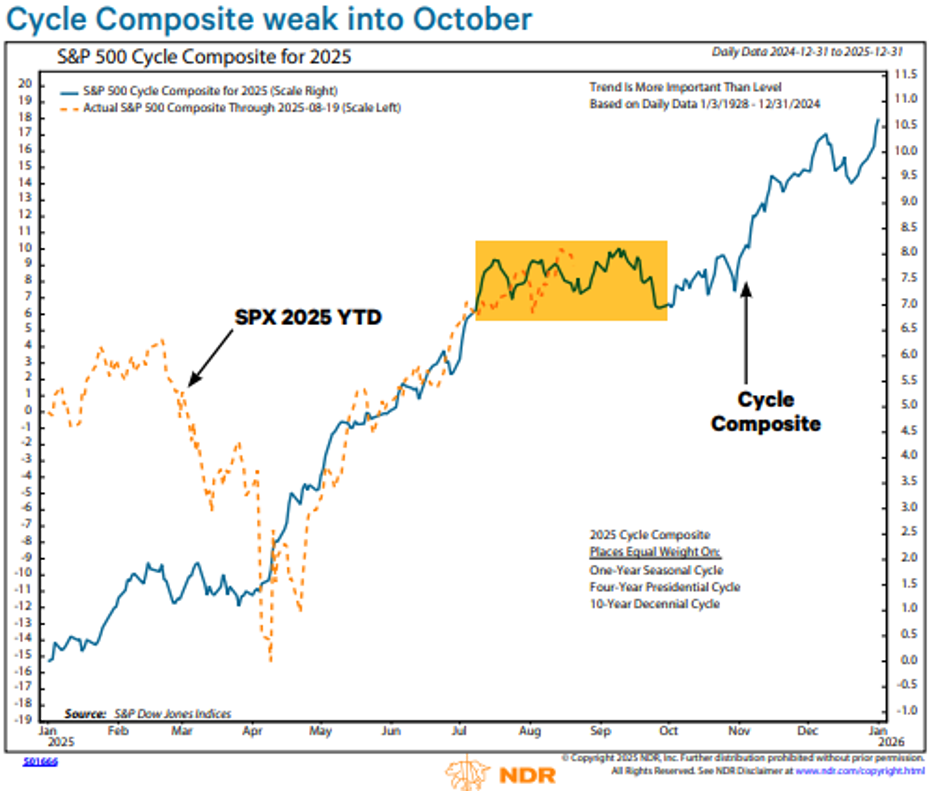
One last point on this August / September period I wanted to point out is the cyclical component of this period. As you have gotten used to, I love to see if there is any statistically significant historical data to support current market expectations. And this period has a high probability due to the NDR S&P 500 Cycle Composite, which combines one year (seasonal), four year (presidential cycle), and 10 year (decennial cycle) historical pattern, which is in a choppy downtrend into October. I have put a yellow box around this period as we are part way through this tough patch already, as illustrated in the August chart below.
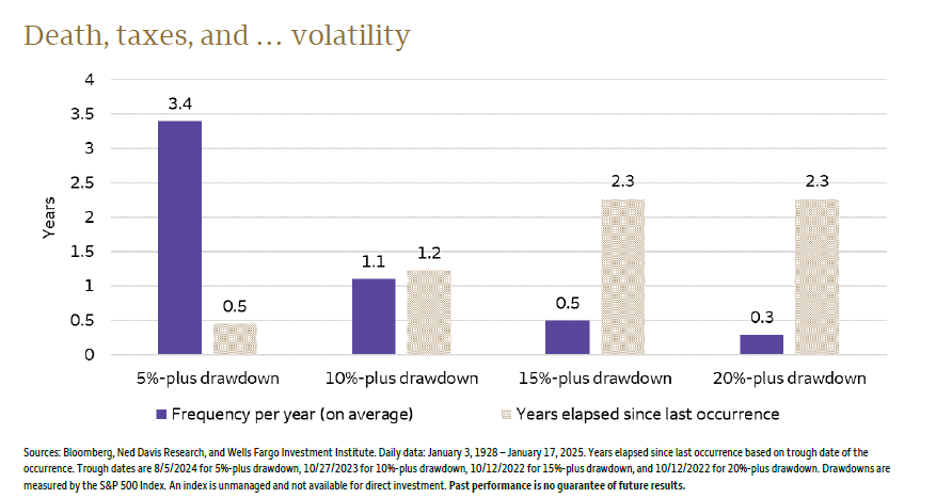
The next logical question, and probably the most difficult one to have an answer to, is how much volatility could be expected in this seasonally tough period. To answer this, I go back to one of my favorite graphics. This one is an analysis of how small, medium and big declines happen, and how often.
Rotations can be healthy. If the winners keep winning for too long, investors eventually pile into the same few names. When the few winners left inevitably run into trouble, the market has nothing to stand on. Rotating into the previous laggards, even if temporary, reduces the risk of a narrowing market that often precedes a major peak. The question from here is whether recent market action is part of a healthy rotation within an ongoing bull market or the start of longer-lasting defensive leadership that is common during bear markets. I believe that we really don’t have a lot of reasons for a medium or large correction because;
- The solid technical position from which the market started in July. A very stable and consistent uptrend.
- The strength of the Q2 earnings season. Not only was earnings growth strong, but even above expectations.
- The lack of widespread optimism. Due to many media induced frictional anomalies, optimism is muted.
We conclude that a rotation as part of a seasonal pullback is the most likely outcome, but we will be watching our models for risks of a more severe decline. As can be seen below, in one of my favorite charts, pullbacks in the area of 5% tend to happen 3.4 times per year, and the last pullback we had was in April, so this would not be unexpected to have a difficult period into late September / early October, as is the norm.
Last Friday’s rally was said to have been sparked by Fed Chair Powell’s desire to open the door for rate cuts beginning in September. As has been the norm, he continued to say that the Fed acts independently of the administration, and that he remains data dependent. He went on to say that although there appears to be some level of weakness in labor, that most all other measures of the economy seem to say that the economy is healthy and isn’t in need of looser money rates.
Powell has also remained transparent in his statements that by being data dependent, that he is acting off historical information and forecasting major changes in policy is very difficult and therefore they are at times late in their decisions on rates. This is what President Trump has been saying. The president believes that the rates need to be lower now, to preempt momentum developing in a negative direction. I believe this is a very tough decision to make and one that Powell is not taking lightly. What I am looking for is the equity market to take a rate cut positively and embark on its year-end rally that Thomas Lee is looking for in his chart above. Here is how markets act coming into rate cuts, and then coming out of them:
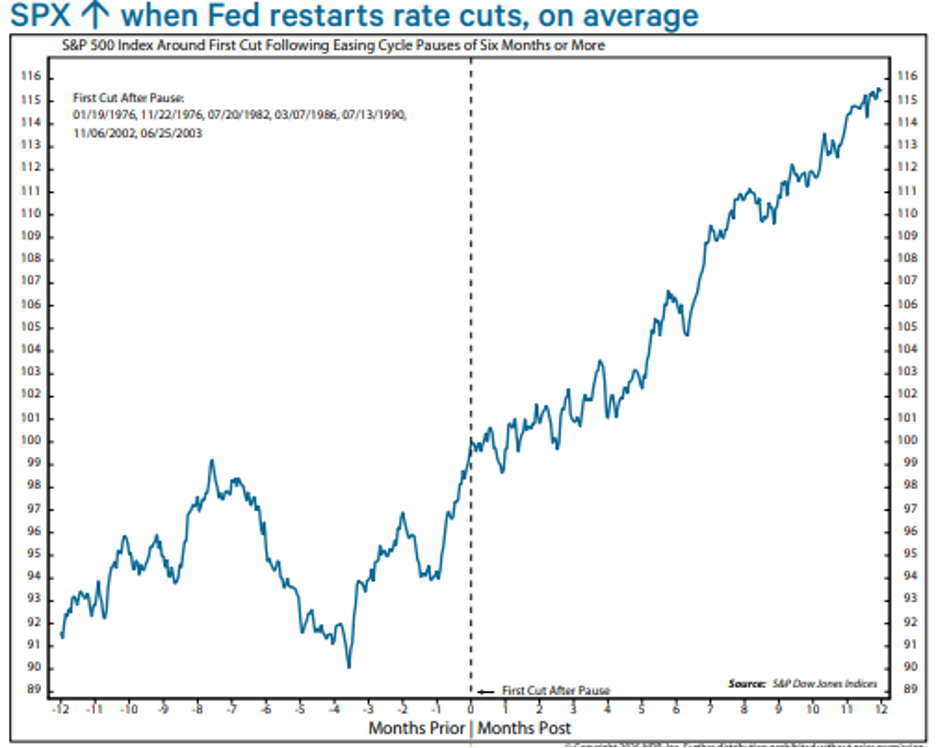
Take a closer look at the chart above. Note that going into a rate cut the market is quite indecisive. This fits perfectly with the August / September negative calendar period. But when the rate cut hits, all negative bets are off and if history is a guide, this could prove to be a very good last quarter of the year.
I believe it is important to pay attention to “the why” Seasonal trends do not occur in a vacuum. The question for the remainder or 2025 is if the factors that often drive subpar equity returns are in place. As I have discussed in previous notes, those forces are in play, but the outcome is TBD. According to the media, the answer lies in the buzzword of the year: tariffs. Before diving into the details, we want to emphasize that our recommendations are driven by our models, which are based on a variety of indicators. We focus on current cyclical moves but also look for very strong correlating calendar types of issues. What is hugely important to remember is that there are many tools in the analytical toolbox, but each tool is useful or not useful at all at different points in time. For this reason, nothing can be completely relied upon. The action of the markets; currency, bond and equity, must always be evaluated for continuations of current moves or changes which could infer that something new is afoot.
According to Jeffrey Saut of Saut Strategy, “the markets do not care about the absolutes of ‘good’ or ‘bad’ but whether things are getting ‘better’ or ‘worse’.” The stock market, at least, was priced for the worst-case scenario after Liberation Day and the decline that coincided with it. As we’ve walked back from the edge of the economic abyss and trade deals have been made, investors have felt better and better about adding back. The economics of the companies as illustrated by first and second quarter earnings reports have proved that the tariff issues were mostly immeasurable and therefore difficult to quantify so many investors ran to the sidelines. The problem with the strategy is one must exercise perfect timing on the exit and then again perfect timing on the reentry.
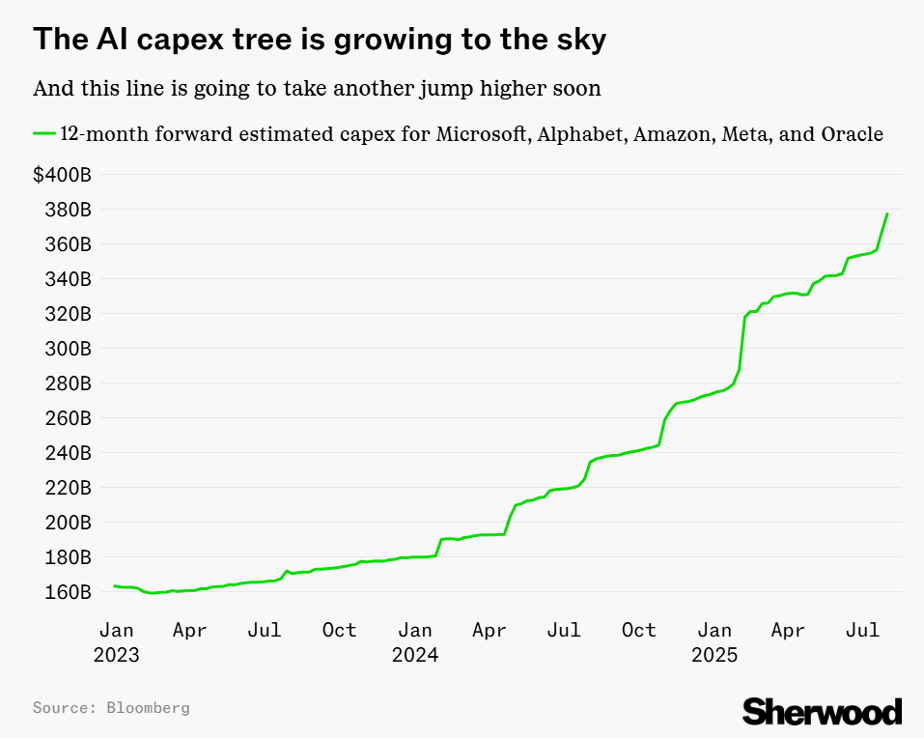
We are still in an uptrend at this point. Within uptrends there are periods where the markets rest. This is currently evident in the technology space. Since this sector has acted as a group of companies that have lifted the indexes, if technology were to weaken or simply move sideways, then the indexes might have their advance stifled. The buzz on the street by the negative prognosticators is that there has been too much emphasis placed on AI and AI infrastructure investment. Currently, this is how the AI capex tree has been growing:
In closing, I am finding that the attention span for the next “factoid” to make shorter- and shorter-term decisions on portfolios is shortening consistently. Unfortunately for those that want or need validation for a decision, these time horizons just aren’t realistic. We are in sort of a dead period right now as the only major catalyst that I can find is if global military conflicts are brought to peace. This would allow focus to go back to productive action rather than destruction.
I hope that the kids get back in school and that football season is in full swing. I will be out of the office this coming week and therefore I will be taking a break on my weekly report. I’ll be back to you Mid-September.
- Ken South, Tower 68 Financial Advisors, Newport Beach
-
Get Ken's Weekly Market Commentary Delivered To Your Inbox!
Important Disclosures:
The opinions voiced in this material are for general information only and are not intended to provide specific advice or recommendations for any individual. To determine which investment(s) may be appropriate for you, consult your financial professional prior to investing. All performance referenced is historical and is no guarantee of future results. All indices are unmanaged and cannot be invested into directly.
All information is believed to be from reliable sources; however LPL Financial makes no representation as to its completeness or accuracy.
Investing involves risks including possible loss of principal.
The Standard & Poor's 500 Index is a capitalization weighted index of 500 stocks designed to measure performance of the broad domestic economy through changes in the aggregate market value of 500 stocks representing all major industries. The S&P 500 is a stock market index tracking the stock performance of 500 of the largest companies listed on stock exchanges in the United States. Indexes are unmanaged and cannot be invested in directly.
The Dow Jones Industrial Average is comprised of 30 stocks that are major factors in their industries and widely held by individuals and institutional investors.
The Nasdaq-100 is a large-cap growth index. It includes 100 of the largest domestic and international non-financial companies listed on the Nasdaq Stock Market based on market capitalization.
The Russell 2000 Index is an unmanaged index generally representative of the 2,000 smallest companies in the Russell 3000 index, which represents approximately 10% of the total market capitalization of the Russell 3000 Index.
Data sourced from Bloomberg (2025).
Stock investing includes risks, including fluctuating prices and loss of principal.
Bonds are subject to market and interest rate risk if sold prior to maturity. Bond values will decline as interest rates rise. Bonds are subject to availability, change in price, call features and credit risk.
Government bonds are guaranteed by the US government as to the timely payment of principal and interest and, if held to maturity, offer a fixed rate of return and fixed principal value.
Bond yields are subject to change. Certain call or special redemption features may exist which could impact yield.
International investing involves special risks such as currency fluctuation and political instability and may not be suitable for all investors.
Alternative investments may not be suitable for all investors and should be considered as an investment for the risk capital portion of the investor’s portfolio. The strategies employed in the management of alternative investments may accelerate the velocity of potential losses.
This information is not intended to be a substitute for specific individualized tax advice. We suggest that you discuss your specific tax issues with a qualified tax advisor.
LPL Tracking #788282