

- The majority of the NASDAQ 100 returns year-to-date has come from four stocks, which is normal. Not abnormal as many prognosticators profess.
- The percentage of stocks outperforming the S&P 500 is no longer at historically bearish levels. When an overly large percentage of companies of the index are outperforming the index, this has historically led to a pullback or digestion of the gains.
- Absolute breadth is more important for the cyclical bull market, and it is decent currently. Even though there have not been the measurable breadth thrusts, breadth is consistent with a firm market in a bullish direction.
The rally off the March 30 lows has resurfaced a common complaint from the past three years: the majority of gains are coming from a handful of high-flying stocks, and that makes the rally unsustainable. I often feel that this is the battle cry from those that were not invested in a manner to take advantage of this relative outperformance due to the strength of a certain few. In reality, their concern makes more obvious and recognizable the difference between relative and absolute breadth in analyzing cap-weighted indices. I have discussed this issue several times in recent years, including in 2024 when the consensus view amongst fundamentally focused strategists, whom we dubbed armchair technical analysts, was that market breadth was alarmingly narrow. Since these same armchair technical analysts tend to be generalist, by nature, they could not participate in concentration where the strength was being seen and instead diluted their overall performance and missed (once again) one of the strongest bull market moves in history.
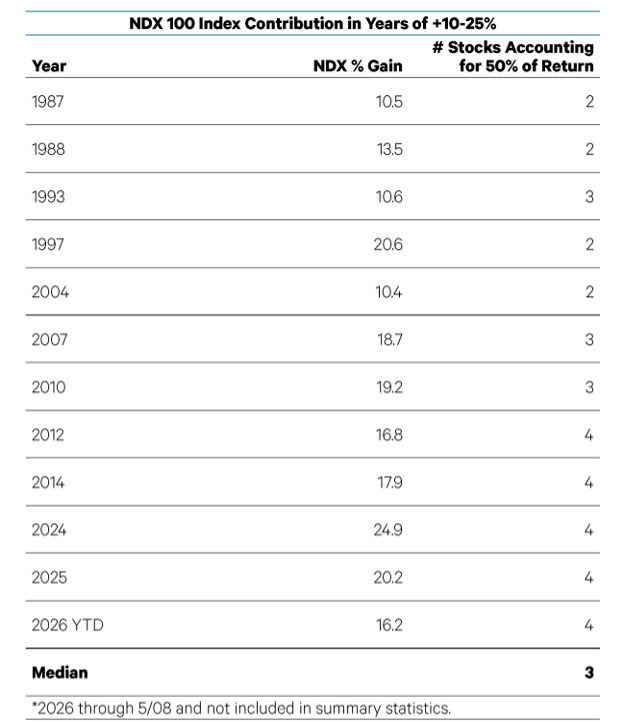
Consider the following two data points. First, math dictates that a small number of stocks drive most of the gains in market-capitalization weighted indices. The Nasdaq 100 Index is up 16.2% year-to-date (as of the second week of May). Four stocks – Alphabet (A & C shares), Nvidia, Micron, and Intel – are responsible for 8.4% points, or 52.3% of the gains. In years when the index is up between 10% and 25%, a median of three stocks is responsible for 50% of the returns. I do not mention these names as a recommendation, but rather a proof of point of where the returns came from. See the table below going all the way back to 1987. Every bullish move had only 2-4 companies that led the charge.
Even more alarming is the overall breadth of the current market. Under the hood the market is in a true digestive action. With market leader Technology already extended, higher rates could make the sector more vulnerable to a pullback. Of course, much of the market has already been pulling back. Less than half of NYSE stocks now remain above the 50-day moving average, and on Friday the number of S&P 500 stocks making new 52-week lows compared to highs quietly hit its second-worst reading since right after the Liberation Day sell-off last April of 2025. One's view of the market really depends on what is being looked at. All is not right in the general market despite the S&P 500 hitting another new all-time high as recently as Thursday.
Under normal circumstances, the combination of an extended S&P 500 and weakening market would, indeed, warrant extra caution, though this has not been a normal market. While Friday's session was the worst since March 27th, it still was insufficient to really do much to change the overall picture. If we look at why the markets could be doing this, it seems to be broken down into three major baskets:
- The Iran conflict seems to be lasting longer than anticipated and for many it “needs” to have an end game articulated or this could be a protracted conflict seriously affecting oil and as such maturing into a recessionary outcome.
- Oil prices causing inflation and therefore consumer recession due to lack of affordability after other broad inflation measures have risen their head. This was evidenced by last week’s PPI number and CPI number.
- A much needed market contraction after years of advance.
In looking at the inflation picture, here is the course of Producer Prices as measured by the PPI index:
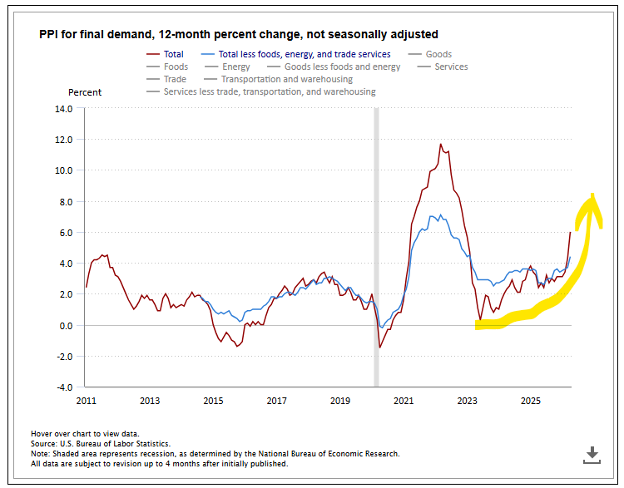
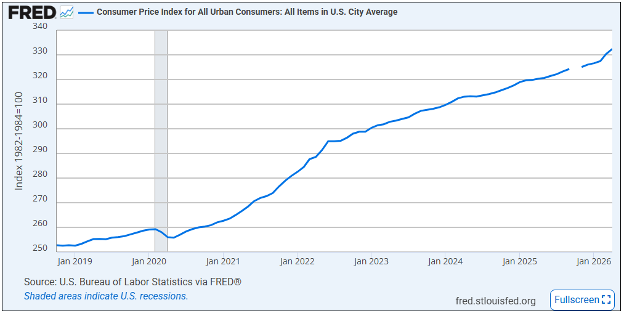
After production prices rise like this if all things remain consistent, it should then flow through into Consumer Prices, as evidenced by the CPI. Here is the CPI progression as measured by th US Bureau of Labor Statistics:
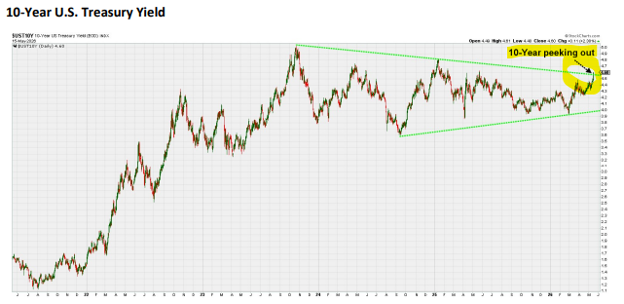
The next step in the chain is what affect this then has on the cost of funds as measured by interest rates. The primary rate that I tend to focus on is the 10-year US Treasury. As can be seen below, this rate has stayed in a fairly consistent range since 2023 and it now breaking out to the upside from this sideways action:
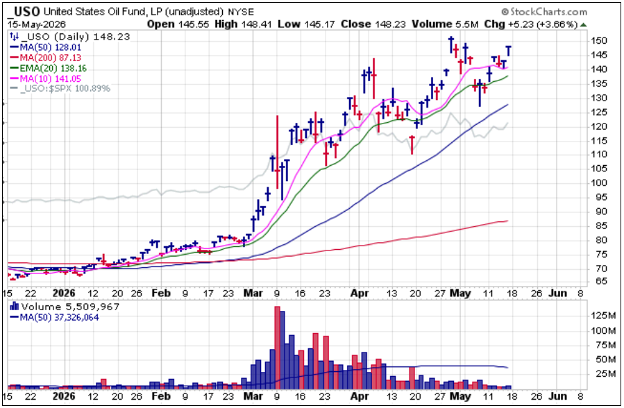
Oil seems to have tamed a bit from its very high levels, but seems to be staying stubbornly high, and will almost be sure to do so as the conflict in Iran lacks an end point. Here is the progression as measured by the US Oil Fund. Notice the spike in March and its stubborn lingering at this $100 +/- level since then:
The tradeoff to this inflation concern is that of earnings. The question that remains is that in an environment where overall earnings (regardless of why ) are continuing to advance and not only advance at a faster pace than originally projected by analysts, but these same companies are forecasting even higher earnings expansions going forward.
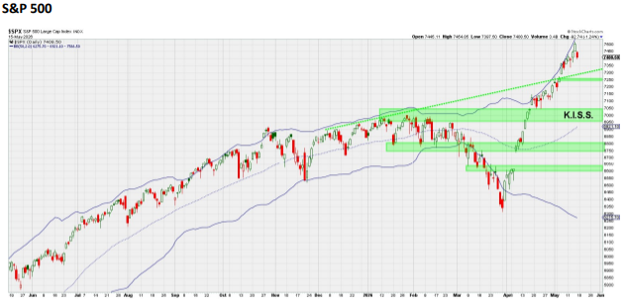
I believe that these strong earnings forecasts could be the reason why the expected digestive phase that I have been talking about for a few weeks could happen, but most likely won’t happen to an extent that would reflect a painful pullback. More specifically, it could happen as a digestion down to approximately 7,000 on the S&P 500. Here is where the Saut Strategy team see it going to. Notice the thick green like right at this level:
I am referring to a pause to refresh, not a changing of the guard. At the same time, this does not in any way forecast continued leadership by these certain few, yet recognizing substantial runways when these sectors / companies begin to exhibit these leadership characteristics has proven to be quite profitable. In recent years, after years of a historically low percentage of stocks outperforming the S&P 500, 62% have been outpacing the benchmark. This is on pace to be the third highest on record. Is this strange? No! Actually, it is not abnormal at all. While a better environment for stock pickers, the unfortunate reality is that in three out of the four years when over 60% of stocks outperformed, the S&P 500 fell by more than 10%: 2000 (-10.1%), 2001 (-13.0%), and 2002 (-23.4%). Year-to-date, the percentage has fallen to 36.5%, on pace to be the ninth lowest since 1973 but well above the near-record lows of the past three years. In other words, it is okay for the generals to lead if the infantry is following. The bull market would be in more trouble if there was a mutiny coming from the ranks of average stocks.
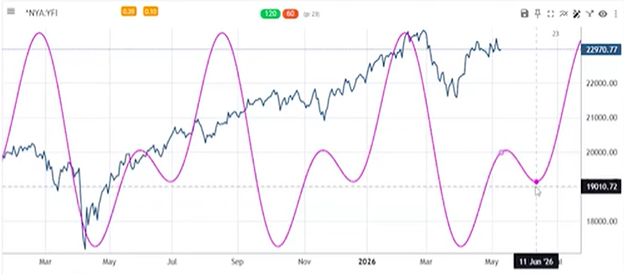
Taking a far shorter-term tack, I wanted to discuss the short-term digestion that I have been expecting for many different reasons: seasonal, Midterm, new Fed Chairman (on top of the bullet pointed items mentioned above), and simply up so much so quickly. Based on the cycle work of Tom Newton of FundStrat Direct and Larry Williams, the cycle shows an inflection point in mid-May and a bottoming that is expected around June 11th. This is pretty exacting to be sure, but this is the work of some people that I respect and pay attention to. Please note in the illustration below that this cycle work clearly called the bottoming process of last year and the March 30th low of this year. It isn’t always perfect, but I tend to respect probabilities should they show themselves as being correct. Here is the cycle work. Please also note what is expected post June 11th.
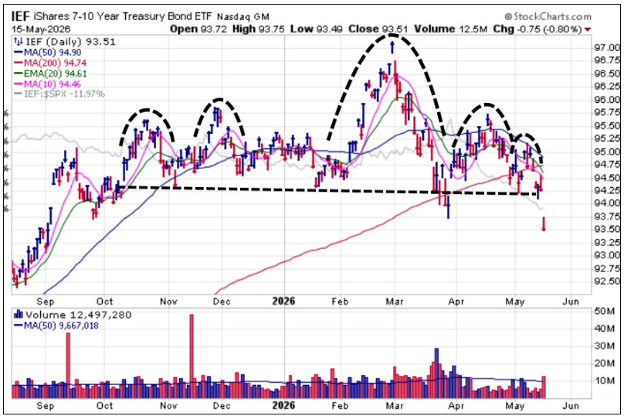
In closing, I don’t believe that the incredible strength in earnings- across many different sectors of the economy can be discounted or cancelled out by a market digestion. What I do feel could be the true fuel for this pullback is the rather aggressive up move in interest rates. I point out the price of 7–10-year bonds as this price moves inversely to the move interest rates, i.e. When rates go up, bond prices go down. As can be seen below, the overall price of these bonds has been very heavy and finally gave up the trading range with the spike up in rates this past week:
Declines seem to be much shorter in time span than advances. Some say, elevator down, escalator up! The elevator has been going down for a few weeks now according to my work. How long will it go down? Until it turns around and starts to go back up.
We will be vigilant at following this progression over time and will be sure to let you know if we feel the probability of a positive outcome overtakes that of a decline. Stay tuned!
-Ken South, Tower 68 Financial Advisors, Newport Beach
Important Disclosures:
The opinions voiced in this material are for general information only and are not intended to provide specific advice or recommendations for any individual. To determine which investment(s) may be appropriate for you, consult your financial professional prior to investing. All performance referenced is historical and is no guarantee of future results. All indices are unmanaged and cannot be invested into directly.
All information is believed to be from reliable sources; however LPL Financial makes no representation as to its completeness or accuracy.
Investing involves risks including possible loss of principal.
The Standard & Poor's 500 Index is a capitalization weighted index of 500 stocks designed to measure performance of the broad domestic economy through changes in the aggregate market value of 500 stocks representing all major industries. The S&P 500 is a stock market index tracking the stock performance of 500 of the largest companies listed on stock exchanges in the United States. Indexes are unmanaged and cannot be invested in directly.
The Dow Jones Industrial Average is comprised of 30 stocks that are major factors in their industries and widely held by individuals and institutional investors.
The Nasdaq-100 is a large-cap growth index. It includes 100 of the largest domestic and international non-financial companies listed on the Nasdaq Stock Market based on market capitalization.
The NASDAQ Composite Index measures all NASDAQ domestic and non-U.S. based common stocks listed on The NASDAQ Stock Market. The market value, the last sale price multiplied by total shares outstanding, is calculated throughout the trading day, and is related to the total value of the Index. Indexes are unmanaged and cannot be invested in directly.
The Russell 2000 Index is an unmanaged index generally representative of the 2,000 smallest companies in the Russell 3000 index, which represents approximately 10% of the total market capitalization of the Russell 3000 Index.
Data sourced from Bloomberg (2025).
Stock investing includes risks, including fluctuating prices and loss of principal.
Bonds are subject to market and interest rate risk if sold prior to maturity. Bond values will decline as interest rates rise. Bonds are subject to availability, change in price, call features and credit risk.
Government bonds are guaranteed by the US government as to the timely payment of principal and interest and, if held to maturity, offer a fixed rate of return and fixed principal value.
Bond yields are subject to change. Certain call or special redemption features may exist which could impact yield.
International investing involves special risks such as currency fluctuation and political instability and may not be suitable for all investors.
Alternative investments may not be suitable for all investors and should be considered as an investment for the risk capital portion of the investor’s portfolio. The strategies employed in the management of alternative investments may accelerate the velocity of potential losses.
This information is not intended to be a substitute for specific individualized tax advice. We suggest that you discuss your specific tax issues with a qualified tax advisor.
The economic forecasts set forth in this material may not develop as predicted and there can be no guarantee that strategies promoted will be successful.
LPL Tracking #1111681