


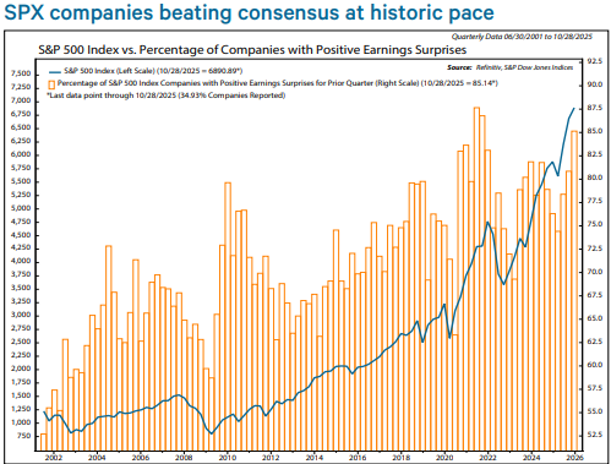
The news of the markets last week was the earnings of the monster tech companies, and the interest rate cut by the U.S. Fed. The earnings were clearly the wild card as the outcome was a mixed bag. Really good on a couple and not what the doctor ordered on a few others. We analyzed the Q2 earnings season, concluding that earnings growth should remain solid in Q3 but corporate America replicating their stellar Q2 performance is unlikely. So far, Q3 is better than we anticipated. With 35% of S&P 500 companies reporting, 85% have exceeded expectations. If the percentage holds, it would be the third highest on record. Clearly this number reflects an equal weighting of each company and is purely statistical, hence the volatility in the markets as the Magnificent 7 have such a huge vote in the prices of the indexes that this stat does not dovetail with the price movement of the overall indexes. All the same, as can be seen below, the numbers were great, and this means that even though labor growth is terrible (for many reasons) and therefore provided the necessary fuel for the Fed to cut rates, the underlying economy here in the US is quite robust.
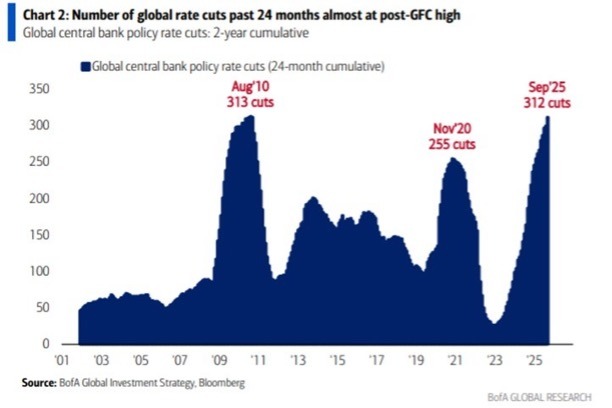
World central banks have cut rates 312 times over the last 24 months, the 2nd-highest total in at least 25 years. This is just one rate cut below the response to the 2008 Financial Crisis. By comparison, the 2020 COVID pandemic brought 255 cuts. This also marks a massive jump from just 30 rate cuts during the 2022–2023 period. Central banks are slashing rates at a pace only seen during recessions. So, while some say interest rate cuts always lead to recession, they are only taking in two data points: rate cuts in 2001 and 2008 which led to recession, while ignoring cuts in the 1990s which did not lead to recession. Further, 2001 and 2008 are only two data points, and both can be explained by one-offs: the dotcom bubble burst and the global financial crisis (GFC). The current situation of aggressive rate reduction in the face of inflation remaining above central bank targets and strained growth is unprecedented, brought on by record levels of global debt which has reached a record $338 Trillion, up from $305 trillion a year ago. Meanwhile, total US debt officially crossed above $38 trillion for the first time in history. This marks a +$500 BILLION jump this month, or +$23 billion per day.
Debt leads to more debt as debt interest expense grows. This necessitates the need for central banks to create more fiat which further devalues fiat, creating a “monetary flywheel” where inflation, easing, and new debt feed each other. Effectively, the world’s major economies are attempting to sustain moderate growth through renewed monetary easing in an environment of stubborn inflation and record leverage, a scenario unprecedented in modern financial history. Global monetary easing remains in full swing. I of course am not positive, but I believe that the rate cuts- globally are due to the massive amount of debt-globally and the never-ending interest expense of this debt. As it stands, due to the strength of our economy and our leadership in technology, healthcare, and industrialization, we continue to be the cleanest shirt in a very dirty global hamper.
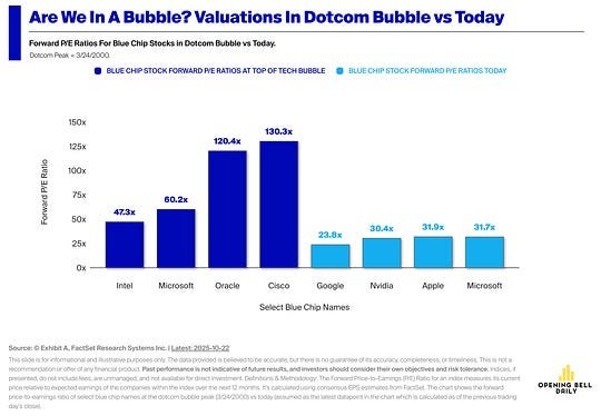
Dotcom vs AI bubble
Leading tech companies currently trade around 30x forward earnings while generating record cash flows and profitability and YouTube’s parent looks even cheaper. I single these out as they are all massively profitable, and this is the spectral opposite to what was the case in 1999, going into the Dotcom debacle of 2000. Back in the late 90s near the height of the dotcom bubble, Cisco Systems and Oracle traded above 120x earnings while Microsoft’s multiple was roughly double its current level.
Furthermore, big tech companies driving this cycle are producing hundreds of billions in annual free cash flow unlike the leaders of the dot-com era which made far less. Bubbles pop when technology fails to monetize. The companies pushing AI forward are the most profitable businesses in history and help drive real productivity gains. What I find as a direct reflection of this is earnings spikes occurring in old-line industrial companies that have been able to multiply earnings simply by adding the efficiencies of AI. The negative repercussions being the decreasing need for labor headcount as many jobs can be eliminated completely with the use of AI.
Calling the whole AI sector a bubble pushes mainstream media to assume every time we start into a market correction it is the start of the bear phase in market price movement. The fact that many keep trying to call a top as the major averages continue to hit new highs over the last many years is one reason the saying holds: Markets can remain irrational longer than one can stay solvent. But irrationality is relative. Some of the biggest money is made over a span of years while markets allegedly remain irrational. In my history, I’ve heard many espouse their reasons why markets can’t possibly advance, but if history is the best teacher, this is a fool’s errand, baring brief periods of correction / digestion.
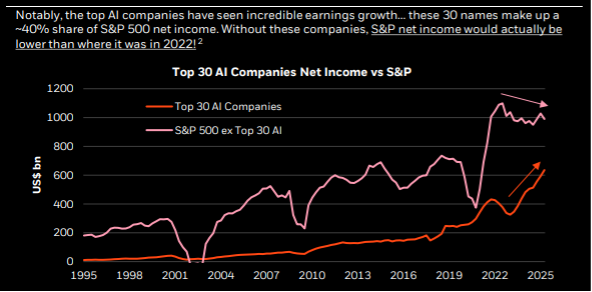
Finally, underscoring the productivity generated from AI, ChatGPT customer retention is equivalent to Uber in 2015. Huge businesses (plural) are being built on top of the shoulders of AI. Of course, with expectations so high, any missteps would result in a fast correction. But as discussed in prior notes, the major bottleneck is likely hardware which is unlikely to hit for at least another year or more. I believe that this is the parallel between today and the Dotcom era. Back in 1999, there were many companies that would have flourished today but back then the world just wasn’t there yet with hardware and overall technology in place to provide the backdrop for great new technology ideas. I found this chart below that shows what the earnings of the S&P 500 were, going back to 1995, separating the top 30 AI companies from the overall S&P. I find the move since 2023 quite fascinating. If one were to wonder why they represent such a large voting constituency within the index and have experienced such dramatic price moves, I think this could be a graphic answer.
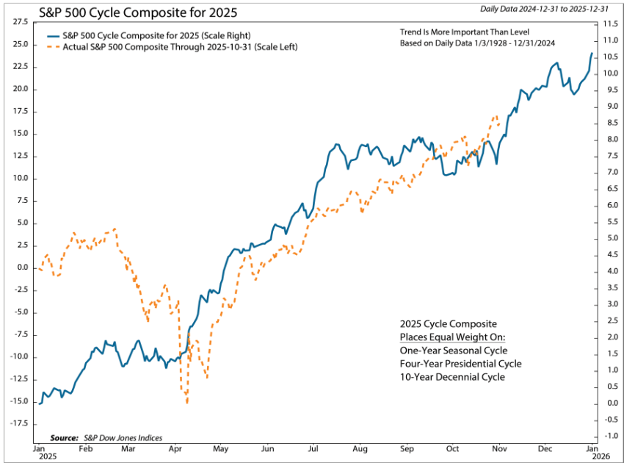
As we round the corner into the end of 2025, we look back and see a very very different year in terms of political issues, but a consistent year as evidenced by the companies that have performed well thus far. This dovetails with the chart above as well. As we end the year, the fourth quarter earnings should be fairly positive, baring the negative effects of the economy slowing due to labor issues. The tradeoff to this being lower costs of capital due to the interest rate cuts and benefits of even greater adaptation to AI and its vast margin expansion capabilities. Eventually these will even hit a critical mass and growth rates will normalize. If we look to see how truly different this year is ending vs. all previous periods, I go back to one of my favorite illustrations, the one that takes into account the 1-year cycle, the 4-year Presidential cycle, and the 10-year decennial cycle. As can be seen, we are just now entering the period that has historically been quite strong. I am somewhat suspect on how truly strong this will be given the breadth divergences, but a win in the plus column is a win all the same!
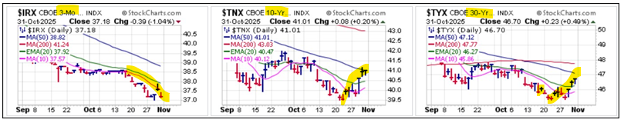
The potential exists for Fed policy to be less market friendly next year. There is a subtle issue taking place right now. I believe that it is a result of the still HUGE $7.7 Trillion still sitting on the sidelines. What I am referring to is the ultimate effect of the rate cut by the Fed last week. Note that the short rates dropped, but the 10-year and the 30-year actually rose. I think that this is because the market sees the rate cut as accommodative, but the ultimate effect is construed as inflationary.
By the time the new Fed chair takes office in May, policy should be neutral or slightly accommodative. Last week I brought up the issue of private debt financing. If we look at the overall level of debt that I brought up at the beginning of this week’s note and the effect of non-bank financing provided by these private debt concerns, longer-term interest rates could rise even while the Fed tries desperately to fix economic growth with short-term lending decreases.
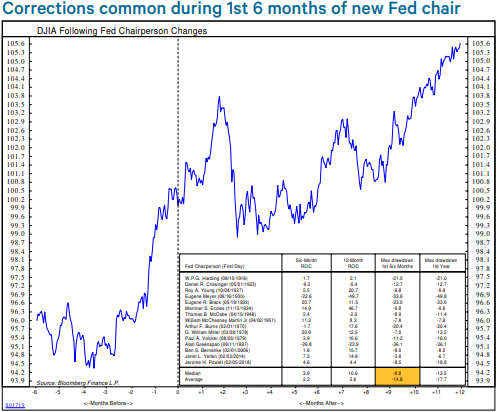
If the new chair pushes a dovish agenda, inflation expectations could rise sharply, impacting mortgage rates and credit spreads. Markets have tested new Fed chairs, with an average correction of 15% during the first six months. See the chart below. Fed independence is one possible test, but other than pandering to the media, is it really going to matter? Economic conditions could manufacture others. Expect theatrics over the nominating process, but with six months to go before Hasset, Waller, Warsh, Bowman, Rieder, or a dark horse assumes the post, markets will likely focus on a friendly Fed for now.
In the end, it is all about earnings, earnings, earnings, and the direction of labor, interest rates, the economy, and (more esoterically) the US Dollar due to the never-ending growth of the debt. The last point, the never-ending growth of the debt is what I see as the spoiling cheese in the refrigerator, but also something that needs to be measured based on the US verses the rest of the world. This is sort of the hormone level of the global economy if you will. Subtle changes can cause mass homeostatic and personality abnormalities, so they must be adjusted very gradually with much preemptive discussion.
Final Thoughts for the week:
Last week I focused on Jamie Dimon’s cockroach statement. I attempted to explain it as a function of the Private Debt markets, the vast amount of money available, and consequently the problems that could come home to roost as a result of a lack of Government supervision and costly oversights in the initial evaluation of the borrower. Well….. on Friday, it was reported in the Wall Street Journal, “Blackrock Is Stung By Alleged Fraud.” It so happens that an unknown private company, Broadband Telecom and Bridgevoice, led by a Bankim Brahmbhatt, of fabricating accounts receivables that were supposed to be used as loan collateral. Sounding familiar??? Apparently HPS Capital (a credit giant recently bought by BlackRock) noticed some “irregularities” with certain email addresses. They hired the accounting firm, Deloitte to investigate. On a Wednesday morning, HPS visited the Garden City, NY offices of Brahmbhatt’s companies to find them closed. When a neighbor was asked if they had seen them, they said they hadn’t seen anyone enter or exit recently. The HPS people then went to his residence. There were two BMWs, a Porsche, a Tesla and an Audi in the driveway and packages on the doorstep with dust collected on them, but no Brahmbhatt….. Poof $500 Million gone! This is a serious cockroach!
The last point to bring to all of your attention is that it is time to put up your Christmas lights now that Halloween is over! We encourage you to get into the holiday spirit and dress things up around your home or office.
- Ken South, Tower 68 Financial Advisors, Newport Beach
-
Get Ken's Weekly Market Commentary Delivered To Your Inbox!
Important Disclosures:
The opinions voiced in this material are for general information only and are not intended to provide specific advice or recommendations for any individual. To determine which investment(s) may be appropriate for you, consult your financial professional prior to investing. All performance referenced is historical and is no guarantee of future results. All indices are unmanaged and cannot be invested into directly.
All information is believed to be from reliable sources; however LPL Financial makes no representation as to its completeness or accuracy.
Investing involves risks including possible loss of principal.
The Standard & Poor's 500 Index is a capitalization weighted index of 500 stocks designed to measure performance of the broad domestic economy through changes in the aggregate market value of 500 stocks representing all major industries. The S&P 500 is a stock market index tracking the stock performance of 500 of the largest companies listed on stock exchanges in the United States. Indexes are unmanaged and cannot be invested in directly.
The Dow Jones Industrial Average is comprised of 30 stocks that are major factors in their industries and widely held by individuals and institutional investors.
The Nasdaq-100 is a large-cap growth index. It includes 100 of the largest domestic and international non-financial companies listed on the Nasdaq Stock Market based on market capitalization.
The Russell 2000 Index is an unmanaged index generally representative of the 2,000 smallest companies in the Russell 3000 index, which represents approximately 10% of the total market capitalization of the Russell 3000 Index.
Data sourced from Bloomberg (2025).
Stock investing includes risks, including fluctuating prices and loss of principal.
Bonds are subject to market and interest rate risk if sold prior to maturity. Bond values will decline as interest rates rise. Bonds are subject to availability, change in price, call features and credit risk.
Government bonds are guaranteed by the US government as to the timely payment of principal and interest and, if held to maturity, offer a fixed rate of return and fixed principal value.
Bond yields are subject to change. Certain call or special redemption features may exist which could impact yield.
International investing involves special risks such as currency fluctuation and political instability and may not be suitable for all investors.
Alternative investments may not be suitable for all investors and should be considered as an investment for the risk capital portion of the investor’s portfolio. The strategies employed in the management of alternative investments may accelerate the velocity of potential losses.
This information is not intended to be a substitute for specific individualized tax advice. We suggest that you discuss your specific tax issues with a qualified tax advisor.
The economic forecasts set forth in this material may not develop as predicted and there can be no guarantee that strategies promoted will be successful.
LPL Tracking #821166