


As you likely know, if you've been reading my work for a while, I try my hardest not to discuss politics. While I feel that my readers don't read my comments due to my political opinions, the primary one is that I don't believe the market cares nearly as much about politics as many individual investors do. Every situation is different, and the polarized nature of today's battle seems to be one of the worst street fights I can remember. For the past couple of months, I have been giving important statistics about how the market does not appear to "prefer" one political party over another, it prefers economic and earnings-related data far more. Over the years I have been told repeatedly that X would happen if so and so wins an election and if Y, then vice versa. Back in 2016, many people assured me that I was ignoring the biggest risk in the market and that if Donald Trump won the election the market would crash. The S&P 500 would, of course, go on to gain around 36% from November 2016 to January 2018 after Trump won and before running into a short-term period of trouble. Likewise, in 2020, I was assured once again by many that if Joe Biden won, the market would crash. The S&P 500 would, of course, go on to gain around 49% from November 2020 to January 2022 after Biden won before eventually running into trouble.
I know I probably won't convince anyone of this, but I don't think either one of these periods had much to do with the man currently sitting in the White House (or wherever he may be given all data on his action and whereabouts have basically vanished from the media's coverage). While some economic indicators did get an immediate "Trump Bump" shortly after he was elected in 2016, these were mostly limited to “softer” data points like small business optimism and consumer confidence and even these had already begun to roll over well in advance of COVID. And as for Biden's presidency, I am not even sure the market has noticed if he's in the White House.
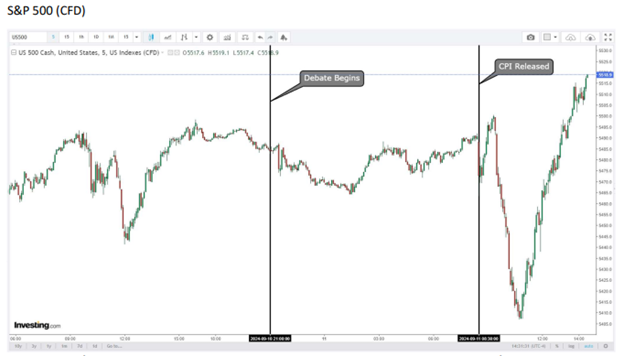
I bring this up because last Wednesday morning I was inundated with texts, calls and Emails regarding Tuesday night's presidential debate and the supposed impact it had on stocks. Some asked me if the market was down because it was pricing in a Kamala Harris presidency (as this is the way it opened on Wednesday morning- see below initial move), while others straight up told me this was why the market was down. This ignores the fact that the equity futures were basically unchanged after the debate or that they only made any sort of real move after the CPI data was released at 8:30 am ET. Wednesday morning took both these meaty issues into consideration, and stocks did their typical post-release whipsaw to part as many from their money as possible. A couple of hours later, Mr. Market caught its stride and began rallying, leaving many emotional sellers in the dust! So, did the market really suddenly change its mind in the middle of the day regarding its views on the debate or the CPI data? I can tell you one thing, the reports that were bantered on CN"BS" certainly were not repeated hours after the initial move. See what actually happened in the time and price chart below of the S&P 500:
My point is, the market is likely going to do whatever it's going to do no matter who, based on different polls and betting odds, ends up in the White House. You don't have to agree with that, but that is what decades of history suggests. For every case where one can point to a political reason why the market did whatever it did, I can just as easily find alternative explanations that have nothing to do with politics. The moral of the story is don't let politics get in the way of your portfolio. And to go ahead and make everyone mad, I don't believe the market "likes" either candidate in this election, and I think the odds are high no matter who is elected that at some point in their presidency the stock market will experience a significant decline. Whoever is in office will likely take much of the blame for this potentially large decline. Remember, after the Stock Market Crash of 1929 when Herbert Hoover was in office and the Great Depression that followed, Republicans did not win another presidential election until 1952 with Eisenhower.
So, I thought I would give you a little more meat to put on the market bones even if by the time you read this the most important data point will be Fed Chairman Powell's decision on interest rates. In the chart below, I once again give an updated picture of where we are today (the dotted line) overlayed on the chart of the average cycle of the market going all the way back to 1929. As one can see, the market tends to experience negative returns in both September and October during Presidential election years, but according to Thomas Lee of FundStrat, this negativity could have been pulled forward and compressed into the first week of September. Of course, only time will tell, but Lee has been pretty accurate these past couple of years.
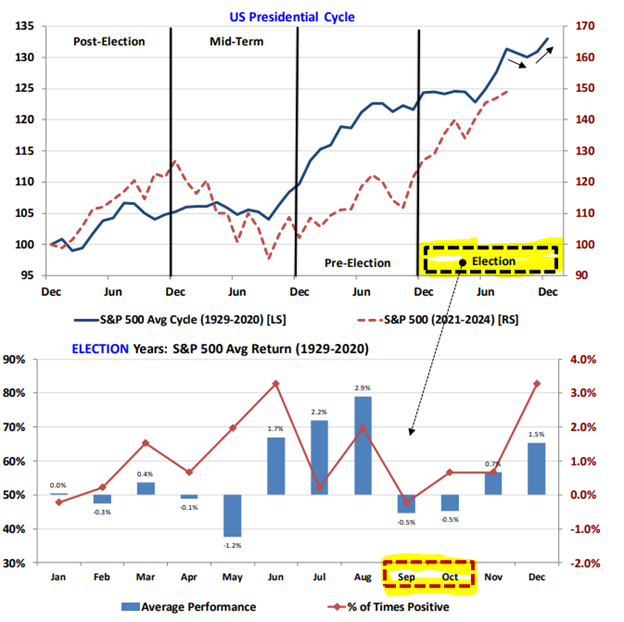
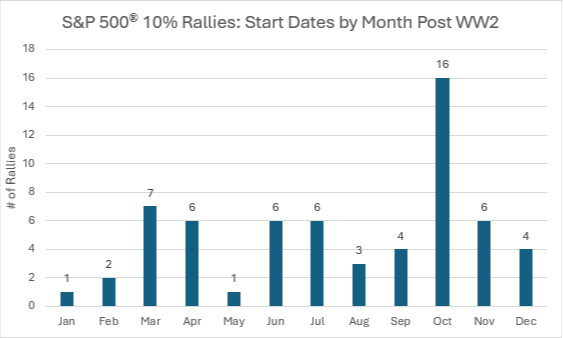
Ironically, this could be setting the stage for a strong rally too. As I showed in the chart last week, if the market has a strong first half (goes up greater than 10%), and suffers a pullback in September, October tends to be the start date for the year-end rally. Going back to World War II, October has a very common occurrence of beginning the next 10% rally more often than any other month:
So why does the stock market have a case of the grumpies this year?
The first reason that I think has substance is a function of economic growth. Given slowing economic reports, there seems to be a growing fear that the Fed is late beginning their rate cutting and this may force them into overdrive to fend off a recession. Many are gaining headline exposure saying we are already in one. One of the most recent data points that supports their thesis is that the ISM PMIs continue to drop and are currently below a 50 number. This implies contraction.
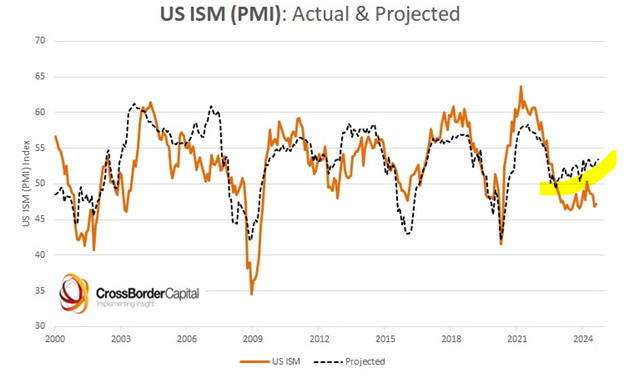
As can be seen above, the brown line which a few months back seemed to bottom, has reversed back down of late and is back plumbing its lows. This may be true, but the forward projections (the dotted line) are on the rise and reflect that the economy is NOT expected to be heading into recession. Credit markets lead the economy by a few months and statistically show strong action as noted by Raoul Pal. ISM also tends to be cyclical, so its lows were likely already reached, especially given accelerating global liquidity and lower rates ala the markets and Jerome Powell. Also, it should be remembered that the US economy is largely service based. The split between services and manufacturing is about 80/20. Based on PMIs, 80% of the US economy that is services is still expanding.
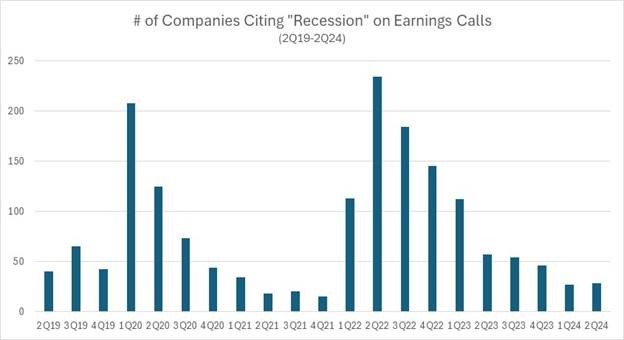
I try and take a litmus test of what companies themselves are saying, and by using AI, and searching for the number of companies this past quarter that cited recession on the horizon on their earnings call, as can be seen below, these mentions have really trailed off.
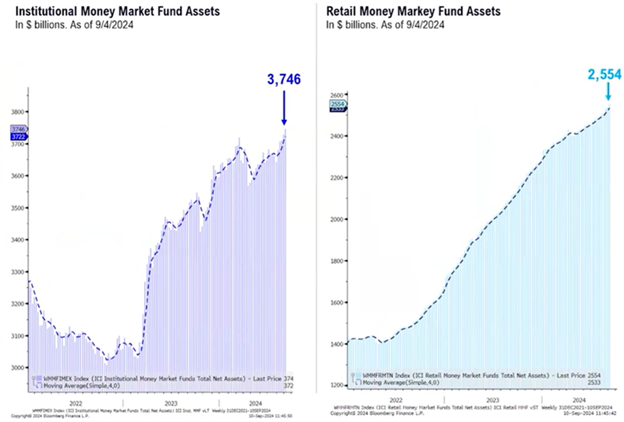
The last major point that I would like to touch on is the amount of money market funds (translated as cash on the sidelines) that Institutions and mom & pop investors have on the sidelines. I look at this as it would be logical that if the stock market was at a major top, there would be a huge margining of accounts by investors and a large drawdown of cash or money market balances. As can be seen below, both institutions and retail investors are at record highs in investable assets sitting in money market accounts. This is an awful lot of dry powder waiting for a reason to be put back to work. Will this come in less fear of impending recession? Will this come from a stabilizing of labor, wages and PMIs? Or will it be simply seasonal weakness having exhausted itself as shown above? Again, only time will tell.
Bottom line: the current September pullback has been consistent with our expectation for choppiness in an election year. With the September weakness relieving the optimism and sending sentiment indicators to excessive pessimism readings, equities would be likely to launch a persistent ascent similar to the first quarter advance of this year. So just as August-October tends to be the weakest (see chart above), October-December tends to be the strongest. As I've also said, the market is not currently vulnerable to the degree of economic and earnings deterioration that would make a bear market more likely than a simple pullback or correction. Unless economic conditions take a turn for the worse, the current choppiness should prove to be just that, not the sign of a more substantial and protracted decline. It should, instead, lead to a buying opportunity within the continuing bull market advance that according to history should resume in the fourth quarter.
So, if my views were not clear already, hopefully this puts them to bed. The global economy and financial markets are bigger than politics. There may be some things a president can do to temporarily aid or hinder them, but in the long run the markets are going to do what they are going to do because they are driven by human nature, the economy, and emotion beyond all else.
- Ken South, Newport Beach Financial Advisor
Get Ken's Weekly Market Commentary Delivered To Your Inbox!
Important Disclosures:
The opinions voiced in this material are for general information only and are not intended to provide specific advice or recommendations for any individual. To determine which investment(s) may be appropriate for you, consult your financial professional prior to investing. All performance referenced is historical and is no guarantee of future results. All indices are unmanaged and cannot be invested into directly.
All information is believed to be from reliable sources; however LPL Financial makes no representation as to its completeness or accuracy.
Investing involves risks including possible loss of principal.
The Standard & Poor's 500 Index is a capitalization weighted index of 500 stocks designed to measure performance of the broad domestic economy through changes in the aggregate market value of 500 stocks representing all major industries.
The Dow Jones Industrial Average is comprised of 30 stocks that are major factors in their industries and widely held by individuals and institutional investors.
The Nasdaq-100 is a large-cap growth index. It includes 100 of the largest domestic and international non-financial companies listed on the Nasdaq Stock Market based on market capitalization.
The Russell 2000 Index is an unmanaged index generally representative of the 2,000 smallest companies in the Russell 3000 index, which represents approximately 10% of the total market capitalization of the Russell 3000 Index.
This information is not intended to be a substitute for specific individualized tax advice. We suggest that you discuss your specific tax issues with a qualified tax advisor.