


It is November 6th, the day after "Election Day." I say " Election Day " as there is sure to be much consternation and negative banter going on by whichever party seems to be the loser. I for one am really happy that this election is about over. I am tired of the friction between friends, family members, and professionals. Marriages have split up; and friendships have been lost and for what! In the end it isn't even the popular vote that determines who is the victor, it is the Electoral College votes.
Waiting is the hardest part
For the last few weeks, I have been saying that the presidential election will come as a welcome relief. I should have been more specific. Most everyone wants to know who the winner is. The anxiety over how we get to that conclusion is palpable. Most accept that the answer will probably not come on election night. As I will explain in this note, polls and betting odds show this race has been a statistical dead heat for months, making it, according to said polls, the closest presidential race in modern history. The market has generally declined amid the political uncertainty, but not in every case. Some years the bullish macro backdrop overrode negative sentiment, after the short-term turbulence.
One point that I had forgotten to mention, that could be the reason for the large turbulence in the markets last week was that October 31st is the end of the fiscal year for many mutual funds. It makes it much harder to trust the price movement on these days as many funds will do trades internally, that can be quite large and market moving to finish their year as they would like. As time progresses over the next month or so, I will not only be bringing to your attention what is going on with earnings, forward projections and continued international flare ups, but also historical statistics and content related to currencies and interest rates.
Will the Election Produce Another Rally?
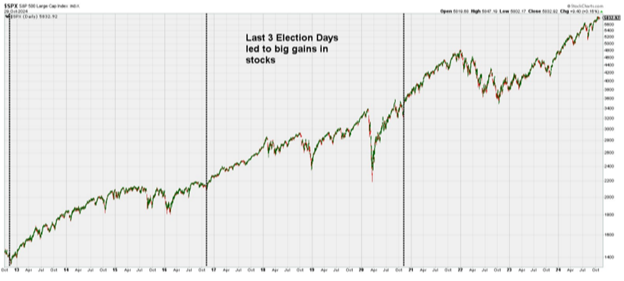
Investors argue every election year about which candidate will be "better" for the US equity markets. Often, though, just having the election behind us can help spark buying, regardless of which candidate wins, particularly if the underlying trend of the market is an uptrend. Keep in mind that large rallies have followed the past three presidential elections (see the vertical lines in the graph below), which saw a different candidate win each time including two Democrats and a Republican. Only time will tell if such a move happens again, though I am curious to see if traders attempt to anticipate a rally by buying in the days to come. I don't bet on events such as elections, so I will just continue to follow my process and trade the leaders and get rid of the laggards.
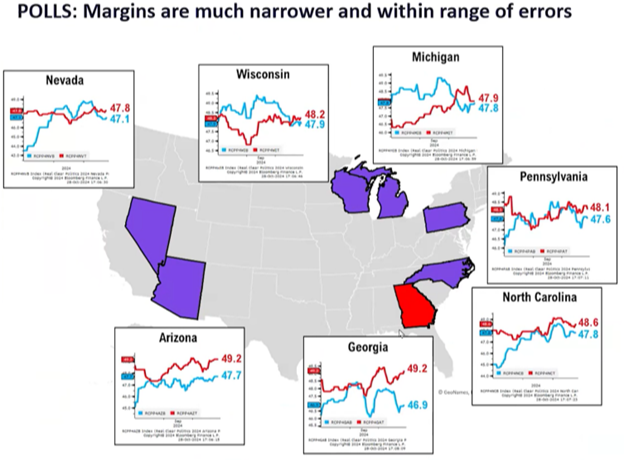
What are the POLLS and the BETTING ODDS saying?
Just to give you a couple of statistical analyses of the seven Swing States. Please remember that these are not my beliefs or me making a political commentary, they are simply the numbers as they are being reported. I will start with what the POLLS stated at the end of last week. As can be seen, they were all really too close to call based on the POLLS. Many will say that only one party was predominately questioned to make up the POLLS, but whatever the case, these are what we have:
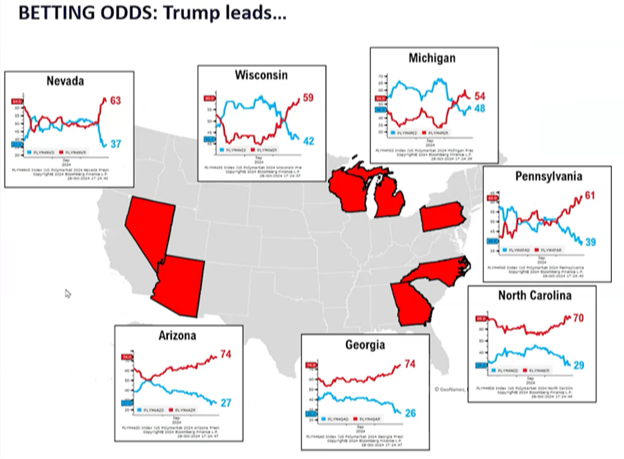
As gamblers will attest, they are always up for a good bet. The election is a perfect place to do this. It could be said that the "smart money" will bet with a high degree of conviction, but since there are no point spreads or players to handicap, it really seems to be more of a testament to what could be expected should the odds be spectral.
As can be seen below, the candidates were pretty close in the gambler world until the last few weeks and then virtually every Swing State showed a huge bias towards the Republican, Donald Trump. I don't bet on things like this, nor do I recommend investors do so either, but these are the numbers based on data provided to me by Tom Lee and his crew at FundStrat. For the last couple of weeks Tom has had to make overt comments that he is simply providing the facts as he has been given them, and this is not his opinion or endorsement in any way. Much like I started this note about the level of friction present in this election, Tom has actually had people discontinue subscribing to his research platform due to these numbers!
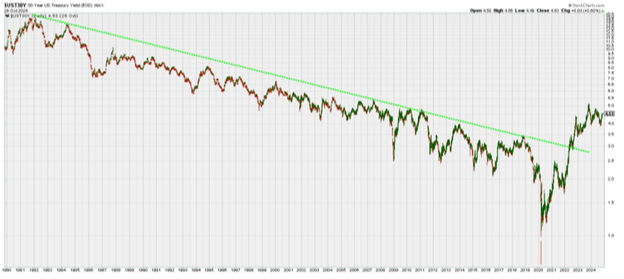
OK, I'm done with this, now on to what I do feel is important. The most important issue that I have found that needs to be singularly addressed, to me, is this continuous move higher in longer-term interest rates. I believe that this quick move from 3.6% to 4.3% since September 18th demands attention. The rates may back off a bit after this straight run up, but due to the amount of cash on the sidelines, the level of debt at the national level and the continued resiliency of the economy makes me believe that rates could go higher over the next several years.
It has been a long time since I shared a long-term chart of the 30-year US Treasury yield. Really, there hasn't been much reason to mention it since the major breakout that occurred back in 2022. That important development broke the 40-year downtrend in rates and, in my opinion, likely drove the final nail into the coffin of the corresponding secular bull market in bonds. Now, there is definitely room for rates to go lower (in the short run) without really changing the bigger picture, but ultimately, I believe this chart suggests that we should expect higher rates in the years to come. That seems to be supported by the underlying economic / fundamental picture as well.
I have no clue how high rates go, but I agree with Paul Tudor Jones that this doesn't exactly make me want to invest in bonds with longer than a 5-year maturity and preferably remain much shorter than even that. Blindly buying bonds because it worked for 40 years is a terrible reason to feel they are the best trade-off to stocks. Marinate on this statement. Virtually every service espouses 70/30 or 60/40 or…. In reference to stock to bond mixture for risk aversion. THIS MODEL BROKE WITH THE MOVE IN 2022.
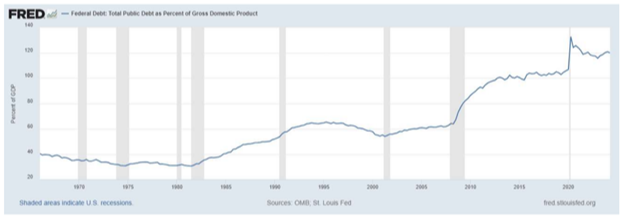
Eventually rising rates can take their toll on the equity market, and in many interviews with smart, big picture people, it has been stated that the huge rise in the Federal Debt as a percentage of GDP that has occurred in recent history is a problem. And if the presidential candidates can actually get their proposed tax and spending plans passed (a big "if"), then it's likely that this number will continue to rise even higher. Jones and his firm estimate that it will move much higher over the next few decades. If so, there could be a major risk that eventually the market decides enough is enough and there could be unfortunate consequences.
As can be seen below, the debt started to rise in the early 1980's, leveled off in the 90's, spiked higher to rescue the banking system during the Great Financial Crisis in '08, was fairly stable until the COVID spike, and have sort of leveled off in the last few years.
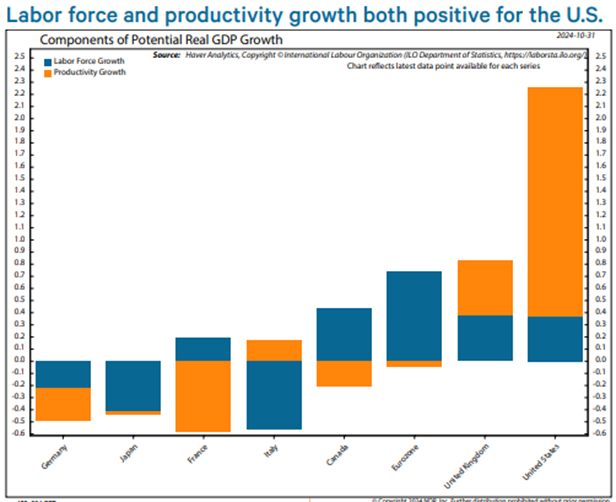
Debt aside, the question every investor should always ask themselves is how the US economy is doing relative to expectations and compared to the rest of the world. The US economy has been on fire. It avoided recession and even stagflation, unlike many of its developed economy peers, after rigorous central bank tightening. And now with the Fed easing, real GDP grew a whopping annualized 2.8% in Q3. This US strong economic growth is most clearly explained by its relatively greater growth potential. This is driven by two distinct measures: Labor Force, and Productivity.
The US economic recovery since the pandemic has been even more astounding, especially when one compares it to the rest of the G7. As shown in the chart, US Labor and Productivity are much stronger than any of the other G7 countries.
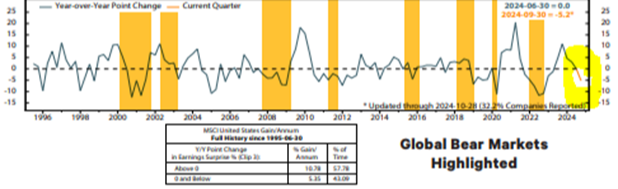
In closing, I feel that talking about where we are with the Q3 earnings is important. The down market of 2022 gave way to a new cyclical bull with renewed beat rate momentum. But after the Q3 reports from about half of the index constituents, the rate is running at a seven-quarter low (in its rate of ascent). Another peak in beat rate momentum is now evident as seen in the chart below.
When the momentum has been negative, going back to 1995, the index (stock market) has performed about half as well as it has with the momentum positive. This negative rate of acceleration has been a characteristic of global cyclical bear markets. But even through the second quarter, the beat rate's year-to-year point changes were negative for the Japan, Pacific ex. Japan and Emerging Markets indices. The all-world indexes beat rate's point change has turned negative as well, with the momentum negative for the majority of the developed countries. Even the sector beat rates have declined from peaks reached earlier in the current bull market. I don't mean to say the bull market is over, but rather that this bull probably won't continue to lift all boats, and selectivity could become much more important.
Maybe a little political quiet would be nice to have. Halloween is over, our Dodgers won the World Series, and one of my favorite holidays, Thanksgiving, is in a couple of weeks. Have a great rest of the week and stay tuned, I'm sure there will be plenty of fireworks before this whole election period is over and done.
- Ken South, Newport Beach Financial Advisor
Get Ken's Weekly Market Commentary Delivered To Your Inbox!
Important Disclosures:
The opinions voiced in this material are for general information only and are not intended to provide specific advice or recommendations for any individual. To determine which investment(s) may be appropriate for you, consult your financial professional prior to investing. All performance referenced is historical and is no guarantee of future results. All indices are unmanaged and cannot be invested into directly.
All information is believed to be from reliable sources; however LPL Financial makes no representation as to its completeness or accuracy.
Investing involves risks including possible loss of principal.
The Standard & Poor's 500 Index is a capitalization weighted index of 500 stocks designed to measure performance of the broad domestic economy through changes in the aggregate market value of 500 stocks representing all major industries.
The Dow Jones Industrial Average is comprised of 30 stocks that are major factors in their industries and widely held by individuals and institutional investors.
The Nasdaq-100 is a large-cap growth index. It includes 100 of the largest domestic and international non-financial companies listed on the Nasdaq Stock Market based on market capitalization.
The Russell 2000 Index is an unmanaged index generally representative of the 2,000 smallest companies in the Russell 3000 index, which represents approximately 10% of the total market capitalization of the Russell 3000 Index.
This information is not intended to be a substitute for specific individualized tax advice. We suggest that you discuss your specific tax issues with a qualified tax advisor.