


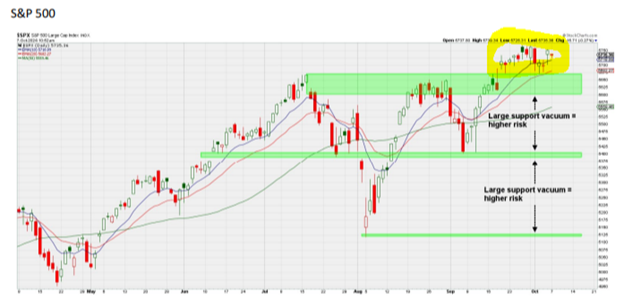
If you only read headlines and watched the nightly news, you may be surprised to hear that the S&P 500 currently sits at all-time highs. In fact, the market’s near 5% gain in the third quarter is better than the “average” third quarter dating back to 1950. Identifying and managing potential distractions or “noise” is essential. Even though the market is at new highs, I still believe that given the amount of “traffic” going on in the world, we should remain in a wait and see period until around election day. I don’t mean to sell existing portfolios, but rather to act with some trepidation in investing idle funds. With selling still muted and the S&P holding above its recent breakout point, I continue to feel we must defer to the uptrend and look for an eventual upside resolution. See the picture below that shows the index finally and decisively breaking through the high-water mark on its third try. I have highlighted this in yellow:
Now that we are in the last quarter of an election year, the long-awaited rate cuts give some confirmation to the odds of a soft (or no) landing. This was further confirmed by last week’s stronger than expected economic reports:
- Unemployment dropped from 4.2% to 4.1%. Clearly not recessionary.
- Payrolls reported on Friday were expected to be up 150,000. They came out up 254,000. Clearly not recessionary.
- Revisions to July and August employment totals raised 72,000. Clearly not recessionary.
- Gross Domestic Product (GDP) expanding to 3%. Clearly not recessionary.
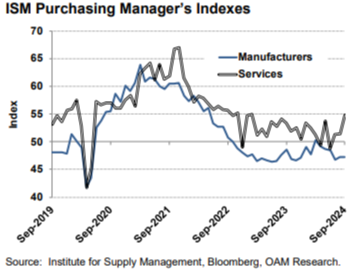
- ISM Purchasing Manager’s Indexes- Focus on Services expansion.
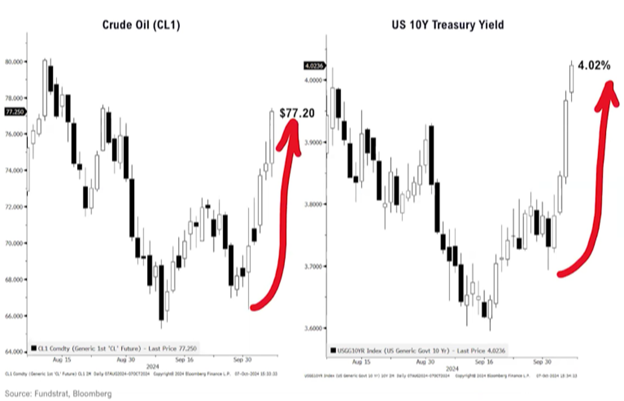
The end result was a major change in the behavior of interest rates. Shorter-term rates, which are dictated by the Fed, stayed stable after the Fed cut the rates. But longer-term rates, as seen by the 10–30-year maturities actually rose quite aggressively. To me, this shows that the bond market expects an eventual rekindling of inflation due to more and cheaper money being catalyzed by the action of the Fed. I believe this is a reflection of the old saying, “It’s the economy stupid.” If the Fed is simply normalizing rates, then the economy seems to be able to take care of itself. And what better way to monitor the heat in the economy other than oil. See how both interest rates and oil are responding below:
Is There A Reason To Sell?
The S&P has put together 43 new all-time highs so far this year, the highest annual tally since 2021. There are always going to be a multitude of reasons to sell stocks, even with markets notching all-time highs. Presidential elections, geopolitical unrest, or an unsure economy each present their own unique “reasons to sell” that could challenge markets in the fourth quarter. In the moment, news is what appears to be most important, but it might not have the long-term effect headlines would lead you to believe.
The Elephant (or Donkey) in the room, no matter if you bleed red, blue or whatever shade “neither” is this year seem to be without reservation as to having impact on different facets of our lives. But does the party really impact markets? The answer to that question is yes, but it comes with a bit of an asterisk. The answer is that markets (and therefore expectations for the US economy) don’t implode simply due to who the commander-in-chief is, the US economic system is far too robust for that. Said plainly, markets show no long-term discernable difference between performance.
According to Joseph Kalish, of NDR Research, “Most polls still say the economy is the most important issue for voters. The general public is more interested in if they are employed, how much they earn, and how much things cost.” This was confirmed and actually obviated by the East Coast Dock Strike last week. The two points were that they want a 77% pay increase over the next 6 years and they want a halt to robotic replacement of jobs. Clearly jobs and income rates.
To give some attention to the current escalation in the middle east, I felt it would be helpful to see how the broad market has fared during previous international squeamishness:
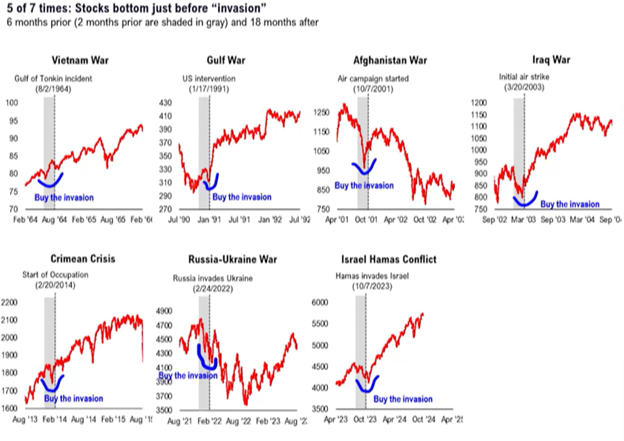
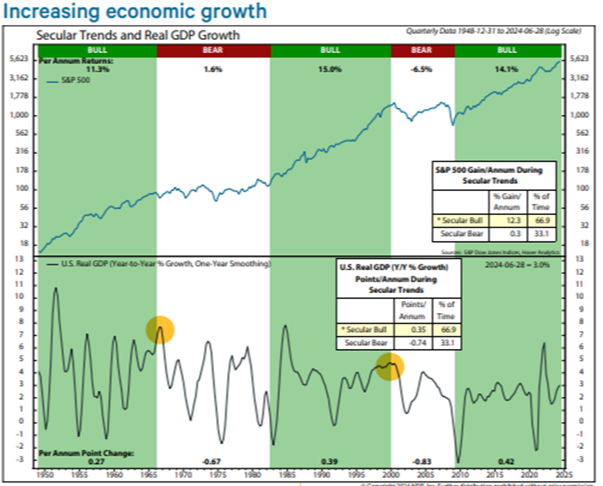
The unknown of an outcome seems to cause markets to go on the defensive, but after the conflict has subsided or come to an end, the markets tend to get back to focusing on the economy. This is reflected in NDR’s overlay of rising and falling periods (bull & bear) when GDP growth statistics are aligned with these rising and falling periods. As can be seen, markets seem to “sniff out” when the economy is softening and equity prices tend to be less robust, whereas when the economy is in an expansion, equity prices advance more aggressively:
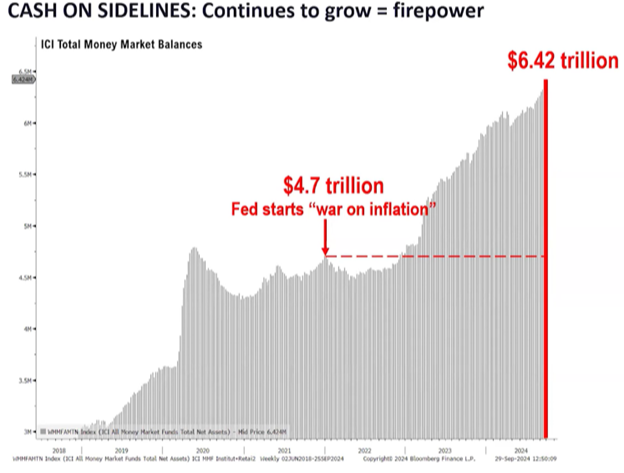
The last point that I want to bring up is that of available capital. Not only does money seem to go to where it is treated best, but when there is over $6 Trillion sitting there looking for a home, it tends to find it in high-quality, publicly traded, corporations in the strongest economies. At present this is still the US.
This week kicks off earnings for Q3, and with it, the next measure of our domestic economy. So far, the equity markets seem to expect a positive set of releases. Beyond this, most investors remain firmly seated on their pins and needles for the next few weeks until our elections are behind us.
- Ken South, Newport Beach Financial Advisor
Get Ken's Weekly Market Commentary Delivered To Your Inbox!
Important Disclosures:
The opinions voiced in this material are for general information only and are not intended to provide specific advice or recommendations for any individual. To determine which investment(s) may be appropriate for you, consult your financial professional prior to investing. All performance referenced is historical and is no guarantee of future results. All indices are unmanaged and cannot be invested into directly.
All information is believed to be from reliable sources; however LPL Financial makes no representation as to its completeness or accuracy.
Investing involves risks including possible loss of principal.
The Standard & Poor's 500 Index is a capitalization weighted index of 500 stocks designed to measure performance of the broad domestic economy through changes in the aggregate market value of 500 stocks representing all major industries.
The Dow Jones Industrial Average is comprised of 30 stocks that are major factors in their industries and widely held by individuals and institutional investors.
The Nasdaq-100 is a large-cap growth index. It includes 100 of the largest domestic and international non-financial companies listed on the Nasdaq Stock Market based on market capitalization.
The Russell 2000 Index is an unmanaged index generally representative of the 2,000 smallest companies in the Russell 3000 index, which represents approximately 10% of the total market capitalization of the Russell 3000 Index.
This information is not intended to be a substitute for specific individualized tax advice. We suggest that you discuss your specific tax issues with a qualified tax advisor.