


While I am not a geopolitical analyst, I will add just a few comments on the somewhat surprising news over the weekend that the United States had invaded Venezuela and captured President Nicolás Maduro. Many experts and non-experts alike appear to be reading between the lines and assuming the move likely has more to do with oil and protecting the U.S. dollar than it does fighting drugs or liberating the Venezuelan people from a dictator. Venezuela holds the world's largest proven crude oil reserves and so was an obvious target given the United States's rocky relationship with the Maduro-led nation.
The fact that Venezuela was willing to sell oil to places like China priced in yuan rather than dollars may have had a lot to do with the decision to remove Maduro as well at a time when there are widespread fears about the debasement of the U.S. dollar and its vulnerable place as the global reserve currency. Energy analysts largely feel the removal of Maduro will have limited impact in the near-term on oil prices but could have big long-term ramifications if the U.S. will now at least indirectly control all that potential oil. The price of oil has largely trended downward for nearly four years, so a price shock move lower would not exactly be too "shocking." Lower oil and gasoline prices should help consumers, though, and when combined with lower interest rates and a weaker U.S. Dollar Index, that trifecta has historically helped to boost stock gains. The S&P 500 has tended to outperform its long-term average over the next year when all of these measures were near their 52-week lows.
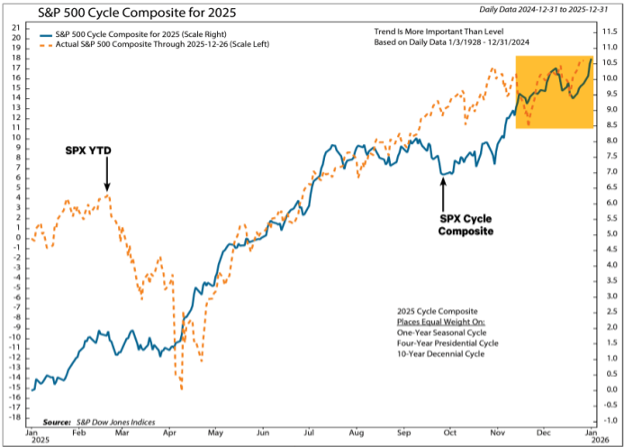
Throughout the years I have often shown the “Cycle Composite.” This is a compilation of every 1-year since 1928, every 4-years since 1928, and every 10-years since 1928. In the picture below, I combine all of these into one composite and have charted the year 2025 against it. It is really quite amazing, I believe, that 2025 was so incredibly similar to times in the past. One can argue about the many different aspects of 2025 that make it “different this time,” but in the end, this is just the way that the markets work. I find this incredibly fascinating and it makes me wonder if other than broad moves that things simply cycle:
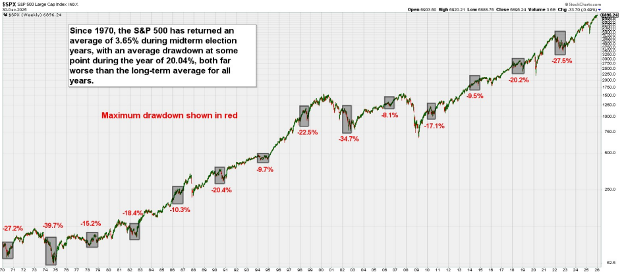
In the continuing spirit of respecting cycles, I bring into focus this week the second year or mid-term year of the 4-year presidential cycle. Midterm Election Years Have Historically Been Worse Than Average. While historical tendencies guarantee nothing, the U.S. stock market has consistently been worse than average during midterm election years in the past. Since 1970, for example, the S&P 500 has averaged a 3.65% return during midterm years compared to the overall annualized price return of around 9% since that point across all years. To make matters worse, midterm years tend to be more volatile and have deeper drawdowns as well. The S&P has experienced an average drawdown of 20.04% during midterm years since 1970, with half of those years experiencing a “bear market” of at least a 20% decline from a year-to-date high. This doesn’t mean that we have to have a bad year this year, but given the statistics, it might be a little tougher than the past three years. Although, from January to April of last year was simply dreadful and look how the year ended up! So, I believe there are many major issues that are really quite positive (I will go over these again next week) so there may be some bumps in the road, but all in all, look below to see how these midterm years pan out. Note that I have put a grey box around the midterm years for reference:
In the case of December, however, the supply of stocks declines as investment bankers wrap up IPOs before the holidays and financial advisors complete tax loss selling. The seasonal strength has tended to start about five trading days before Christmas. The period is generally called the Santa Claus rally. December 17 marked five trading days before Christmas this year, and that is when the S&P 500 made a low. The index rose for five consecutive days by a total of 3.1%, the best five-day period since 2014 and well above the average since 1950 of 0.5%.
Grinch in bull’s clothing
The rally has tended to continue the five days after Christmas. Since 1950, the S&P 500 has risen 68% of the time by an average of 0.8%. Recently, the rally has faded as Santa drove his sleigh out of sight. The S&P 500 has declined in the last three years and in four of the last five by an average of 0.6%. Since 2013, the benchmark has risen only four out of 12 times with a median return of -0.2% even though stocks were in a well-defined cyclical bull market every time except 2015. The change is too recent to declare a new trend, but one possible explanation is that the rise of exchange traded funds that are almost all weighted much like the S&P 500 index at the expense of actively managed mutual funds has reduced the end-of-year window dressing that would put upward pressure on year-to-date winners, which have been mega-caps for much of the last 12 years.
Bottom line
The S&P 500 has followed both the long-term and recent tendency to rally before Christmas. Post-Christmas seasonal strength has not been as consistent in recent years. In general, poor post-Christmas returns over the past 12 years have not foreshadowed a bear market the following year.
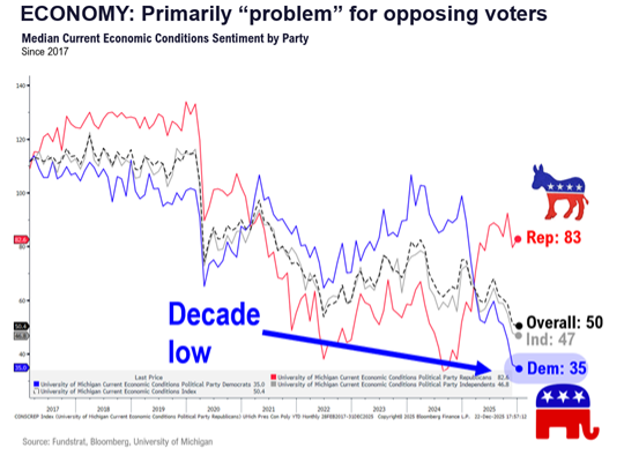
A less than tasteful issue the concept of the media and the constituency of the media from a political standpoint. It is not amazing when this is taken into consideration to see why different actions of President Trump are released to the public, with little bias given to what could “possibly” be a positive reason for the action. For example, how are the parties thinking about the economy? Below is a graph of this. I find this quite telling as the liberal nature of media is aligned with the Democratic side of the aisle. Hence the majority see things as dreadful, yet the GDP, corporate earnings, employment, and overall corporate forecasting are incredibly strong. Go figure!
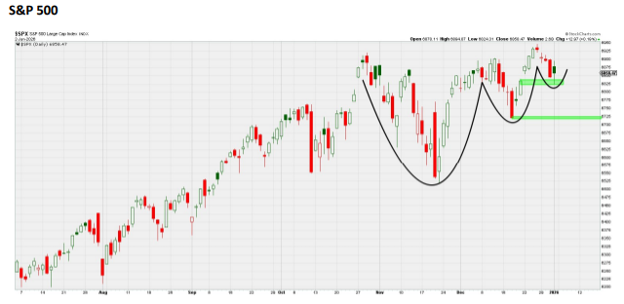
While we should not over-exaggerate the importance of one week, the first five days of the year can set the tone for what follows. "Since 1950, the S&P 500 has posted an average full year gain of 14.2% after a positive first five trading sessions of the year, with an 83.3% accuracy rate, according to the Stock Trader's Almanac" (quote source: Morningstar). And as noted, this year getting off to a good start might be even more important since fading early could increase concern about a potential false breakout in the S&P 500. False breaks often result in sharp reversals in the opposite direction, which could put stocks in an early hole. So, ideally, we see the market build on what a constructive start to 2026 during a lameduck session on Friday. If Monday of this week is any indication, the market seems to be showing its hand a bit. The S&P held support and bounced around its gap low from December 19th. It has almost made higher lows since the November pullback. As can be seen from the picture of the S&P below, it looks more like a balloon trying to be held under the water. It should eventually pop to the upside. Monday could be the beginning of this.
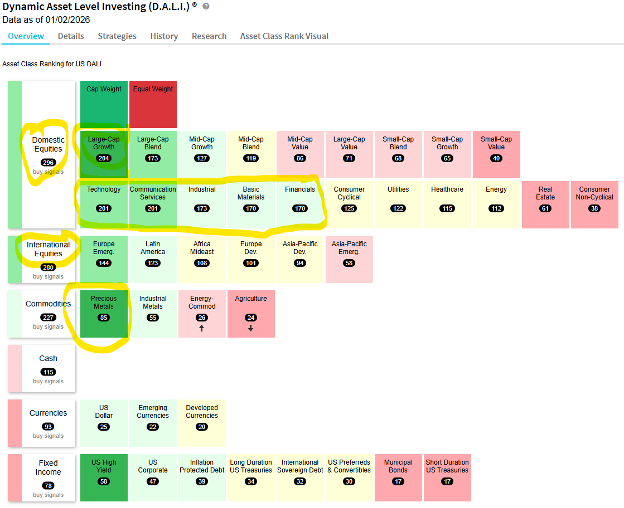
Finally, I wanted to show where we sit in so far as how the relative strength of the markets currently stand. As of Friday, January 2nd’s close, this is where the global financial markets stand. Notice that Domestic stocks still have the relative strength lead, with large-cap growth leading this charge, and the sectors of Technology, Communication Services, Industrials, Basic Materials, and Financials the places that one should be looking. From the international perspective, Emerging Markets seem to be the place and if this first week is any indication, precious metals seem to still have their luster!
Only time will tell.
- Ken South, Tower 68 Financial Advisors, Newport Beach
-
Get Ken's Weekly Market Commentary Delivered To Your Inbox!
Important Disclosures:
The opinions voiced in this material are for general information only and are not intended to provide specific advice or recommendations for any individual. To determine which investment(s) may be appropriate for you, consult your financial professional prior to investing. All performance referenced is historical and is no guarantee of future results. All indices are unmanaged and cannot be invested into directly.
All information is believed to be from reliable sources; however LPL Financial makes no representation as to its completeness or accuracy.
Investing involves risks including possible loss of principal.
The Standard & Poor's 500 Index is a capitalization weighted index of 500 stocks designed to measure performance of the broad domestic economy through changes in the aggregate market value of 500 stocks representing all major industries. The S&P 500 is a stock market index tracking the stock performance of 500 of the largest companies listed on stock exchanges in the United States. Indexes are unmanaged and cannot be invested in directly.
The Dow Jones Industrial Average is comprised of 30 stocks that are major factors in their industries and widely held by individuals and institutional investors.
The Nasdaq-100 is a large-cap growth index. It includes 100 of the largest domestic and international non-financial companies listed on the Nasdaq Stock Market based on market capitalization.
The Russell 2000 Index is an unmanaged index generally representative of the 2,000 smallest companies in the Russell 3000 index, which represents approximately 10% of the total market capitalization of the Russell 3000 Index.
Data sourced from Bloomberg (2025).
Stock investing includes risks, including fluctuating prices and loss of principal.
Bonds are subject to market and interest rate risk if sold prior to maturity. Bond values will decline as interest rates rise. Bonds are subject to availability, change in price, call features and credit risk.
Government bonds are guaranteed by the US government as to the timely payment of principal and interest and, if held to maturity, offer a fixed rate of return and fixed principal value.
Bond yields are subject to change. Certain call or special redemption features may exist which could impact yield.
International investing involves special risks such as currency fluctuation and political instability and may not be suitable for all investors.
Alternative investments may not be suitable for all investors and should be considered as an investment for the risk capital portion of the investor’s portfolio. The strategies employed in the management of alternative investments may accelerate the velocity of potential losses.
This information is not intended to be a substitute for specific individualized tax advice. We suggest that you discuss your specific tax issues with a qualified tax advisor.
The economic forecasts set forth in this material may not develop as predicted and there can be no guarantee that strategies promoted will be successful.
LPL Tracking #844753