


To many investors, both institutional and individual, the current quote that seems to be ringing is, “It’s a Dull Market, You Know.” Funny it seems that when an investor is not concentrated on winning companies / sectors, this is most often said. Sentiment follows price. As prices go up, investors get more and more bullish, and as prices fall, investors turn more negative. It's just the way it works. There isn't necessarily anything wrong with that, per se. Investor sentiment is often considered a contrarian indicator for a valid reason: the crowd is almost always wrong at key market turns and sometimes extremely so. However, this direct relationship between price and confidence also usually works out well for investors for a time and helps to create the sustained trends that occur in the financial markets. The problem isn't that investors follow the trend; it's that their emotions generally become the most extreme at the highs and the lows, often driving them to make the wrong decision at the worst possible time. This is really why I track exhaustion levels. We were at a clear exhaustion in February, and then at clear exhaustion in April, and now we are again getting close to more exhaustion given the strong move in such a short period of time, yet other measures are saying that there is still room for greater upside. Hence the art of investing verses the science.
Clearly, optimism has come roaring back along with stock prices since the April lows. It's easy to forget now but after the major averages crashed 20-30% in a relatively short amount of time, the general feeling among investors two months ago was abject misery. The subsequent improvement in sentiment has been prompted by a definite strengthening across the broad stock market. However, because of that strong recovery over the past couple of months, there now exists this idea, at least among some, that the stock market has done much better than it actually has. The S&P 500 closed last Friday almost exactly where it did on November 11th and was in the red for 2025 as recently as last Monday. Index owners have not been able to participate in the rebirth of the technology sector’s outperformance. Obviously if we use the benefit of hindsight and start measuring right from the absolute low back in April and ignore everything else, there has been a very nice rally over the past two months. Zooming out, however, I would say the last several months and arguably even the past year have been more "dull" market than "bull" market, particularly when using broader measures.
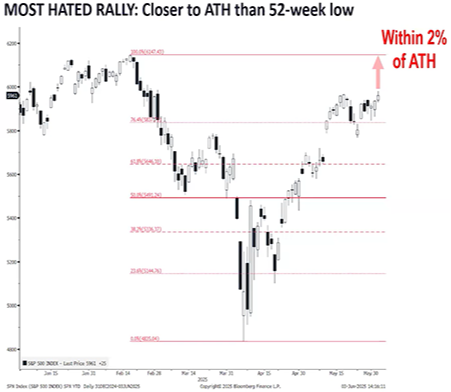
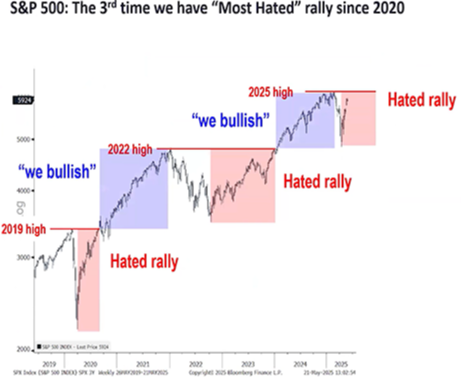
With the markets within 2% of all-time highs, I wanted to again give some perspective on how markets tend to climb walls of worry that seldom make committing money an easy decision (emotionally) for many. Looking back to the COVID crash of 2020, and interest rate hikes of 2022, and then the Tariff Tantrum of this year, this is how the markets are looking:
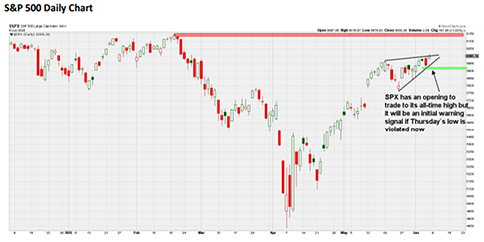
As mentioned, though, Friday was a good session and is responsible for basically all of the broad stock market's progress over the last few weeks. Not only did the S&P 500 hit a new reaction high, but it was close to an 80% upside day and broke many broader measures out to higher highs as well. Since the strong session did follow such a "dull" market over the past few weeks, the market once again has an opening and some upside room to accelerate higher before it's in danger of hitting extreme overbought levels. If the setup fizzles out, however, and holders use the breakout to sell, it will once again raise some red flags. It should be a comparably light week for economic reports, with CPI/PPI the highlight on Wednesday and Thursday. So far, the impact of the tariffs have been milder than expected and the bull case likely needs that to continue. I will note that many of the major indices do now have something resembling rising wedge patterns that have developed over the past couple of weeks. That increases the necessity for the market to accelerate higher here because if we instead get breakdowns from those rising wedges, the resultant declines could be swift.
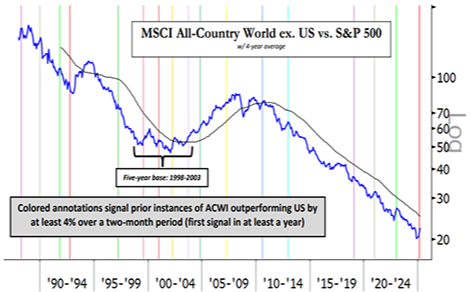
Expanding the markets to take all equities, ex. US equities into account:
In evaluating the markets across the planet and in different asset classes (stocks vs. bonds vs. commodities) it’s important to take notice that MSCI All-Country World Ex. US (ACWI) has rallied through major resistance. Along with rallying above its prior 2021 cycle high, the breakout is also an 18-year breakaway dating back to its year-2007 peak.
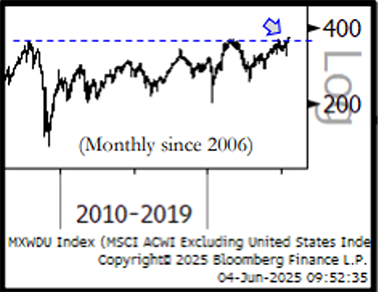
Let’s differentiate between absolute price and relative leadership. In terms of absolute price, we see this major breakout as additional evidence supporting an intact secular bull (US steadiness is underappreciated and global participation is broadening). Relative to the S&P 500, we reiterate that prior instances of ACWI outperformance have marked opportunities to rotate back into the US equities. We do not see this as any different currently. The chart above makes it clear that the price of this all-world ex. US index has now broken out to a level not seen since 2007, but if we are to look really far back, it can be seen that the US has had a level of exceptionalism going back much further, and that except for the brief outperformance in international stock land from approx. 2003-2009, the US has continued to be the holder of the baton. I intend to participate in the international arena given the help that the Trump administration is giving to the a few countries that will benefit from the trade and tariff deals. But this is really a very select few. At this moment, I see advantages in Mexico and India, for reasons open to debate, but suffice it to say that India has a huge labor pool much like China, and Mexico provides very attractive proximity with manufacturing and labor advantages.
With all but two firms in the S&P 500 index having reported for the first quarter, profits in Q1 were up 12.5% from a year earlier on 4.6% revenue growth. These two numbers really piqued my interest. My first thought is how can you make over 12% more if you only sold 4% more? Well, I think this is where AI and technology efficiencies continue to shine through. How long will this happen? I think until these two numbers start to be less different. We persist in thinking that technology today (including AI) is likely parallel to the automobile in the early 20th century after Henry Ford mechanized the assembly line and reduced the cost of the automobile while raising the overall quality of vehicles while increasing levels of production resulting in a change in the way business could execute, and consumers could manage their lives.
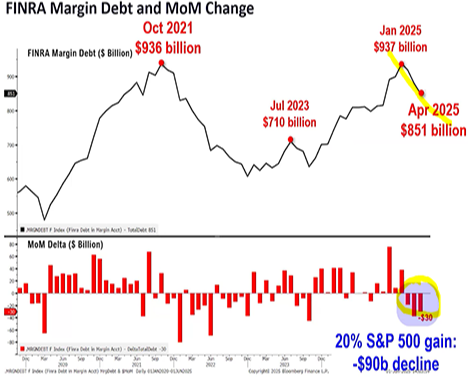
Going back to the art vs. the science, I continuously pay attention to where markets are in their overall progression. If the markets are getting ahead of themselves, then I would expect rampant speculation in the form of margin purchases to be increasing. And yet, if we look at margin debt, it continues to DECREASE since January. This tells me that fear is still rampant and that there could be more room for upside in equity prices.
In closing, it is becoming apparent that many investors have been hoping for a market contraction to be able to deploy capital, but as time wears on the fear of missing out (FOMO) could begin to take hold. If this happens, we could see a most unexpected rally in equity markets, both here and abroad. I believe that the rise being seen in the international markets is actually quite positive for the US markets as it reflects a broadening of the number of issues that are reengaging to the upside. All of this is taking place in the face of stubbornly high interest rates. Last week’s labor numbers hinted to the fact that we are in a sort of Goldilocks economy, with shadows looming overhead from tariff disputes, wars, and the a US budget impasse. Just imagine what could happen if a budget is reached, China and the US agree on tariffs and maybe a war is stopped, things could get really interesting for sure!
- Ken South, Tower 68 Financial Advisors, Newport Beach
-
Get Ken's Weekly Market Commentary Delivered To Your Inbox!
Important Disclosures:
The opinions voiced in this material are for general information only and are not intended to provide specific advice or recommendations for any individual. To determine which investment(s) may be appropriate for you, consult your financial professional prior to investing. All performance referenced is historical and is no guarantee of future results. All indices are unmanaged and cannot be invested into directly.
All information is believed to be from reliable sources; however LPL Financial makes no representation as to its completeness or accuracy.
Investing involves risks including possible loss of principal.
The Standard & Poor's 500 Index is a capitalization weighted index of 500 stocks designed to measure performance of the broad domestic economy through changes in the aggregate market value of 500 stocks representing all major industries.
The Dow Jones Industrial Average is comprised of 30 stocks that are major factors in their industries and widely held by individuals and institutional investors.
The Nasdaq-100 is a large-cap growth index. It includes 100 of the largest domestic and international non-financial companies listed on the Nasdaq Stock Market based on market capitalization.
The Russell 2000 Index is an unmanaged index generally representative of the 2,000 smallest companies in the Russell 3000 index, which represents approximately 10% of the total market capitalization of the Russell 3000 Index.
Data sourced from Bloomberg (2025).
Stock investing includes risks, including fluctuating prices and loss of principal. (132-LPL)
Bonds are subject to market and interest rate risk if sold prior to maturity. Bond values will decline as interest rates rise. Bonds are subject to availability, change in price, call features and credit risk. (116-LPL)
Government bonds are guaranteed by the US government as to the timely payment of principal and interest and, if held to maturity, offer a fixed rate of return and fixed principal value.
Bond yields are subject to change. Certain call or special redemption features may exist which could impact yield.
This information is not intended to be a substitute for specific individualized tax advice. We suggest that you discuss your specific tax issues with a qualified tax advisor.