


Persistent pessimism towards the economy and stocks has been a key driver of the bull market we've been enjoying since October of last year. Much of the pessimism has been thwarted by economic reports that have shown the US economy is stronger than the inflation fighters have been wishing for.
There is an economist at Bloomberg who has thrown out a new term, "vibecession." The word is meant to describe the disconnect between how people feel about the economy and how the economy is performing. In short, Americans have felt worse than the data suggest they should! This vibecession has created one of the most persistent contrarian bullish signals seen in years. I'm sure you all recall the 2022 bear market.
Heading into 2023, investors were on the same side as economists. The 2022 bear market was likely not over if the economic consensus was correct.
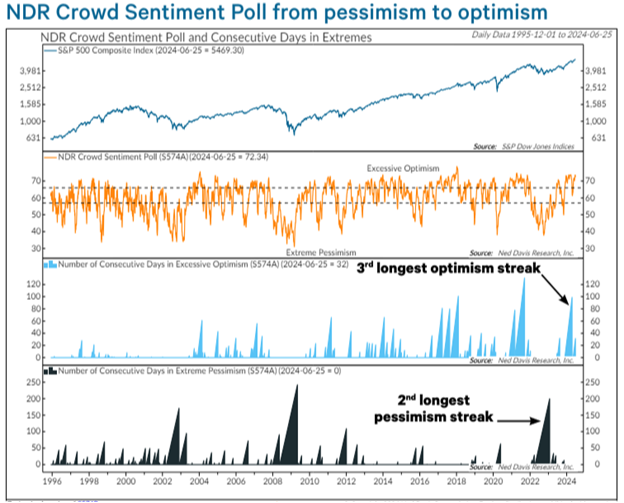
After a 24.2% gain in 2023, economists were still calling for a recession, equity investors had grown more confident, as evidenced by the market advance, and the NDR (Ned Davis Research) Crowd Sentiment Poll completed its third-longest run in excessive optimism on record in April. This followed the second-longest pessimism streak in 2022. The chart below overlays the S&P 500 with these sentiment measures:
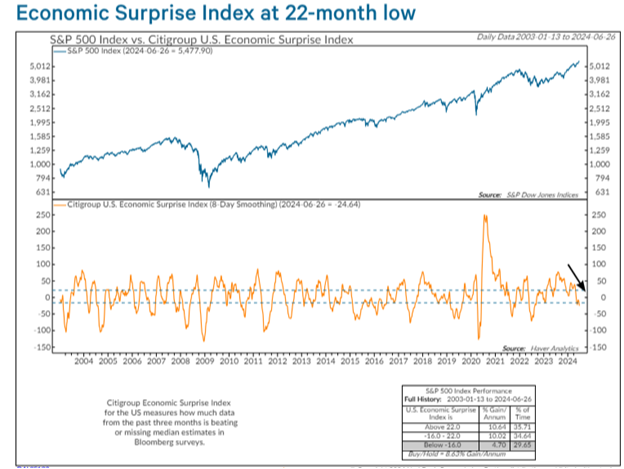
If we look at the Citigroup Economic Surprise Index, sentiment reading can be seen in the fact that Citigroup's Index is at 22-month lows currently which is the opposite of what investor money is saying in the first half of 2024 market advance:
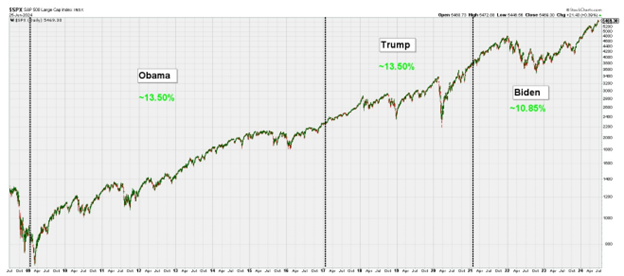
Before I go into the tug-o-war I often refer to between economic strength and inflation, I want to set the records straight on how markets have performed under different administrations. The debate last week was not only embarrassing to our country as a whole, but there has been no lack of commentary on the confusion of our now less-than-feared leader!
But putting all of the current turmoil aside, the question remains (for market people), does the market care who is president as much as the public investors do? Election years are annoying for many reasons, but one pet peeve is the inevitable arguing about which president the market wants to win.
In my opinion, there are things that presidents and their party can do to grease or slow the economic wheels a bit, but the global financial markets are bigger than one political candidate and returns have more to do with the underlying market environment than who is in office. So here is what has been experienced from both parties since the Great Financial Crisis:
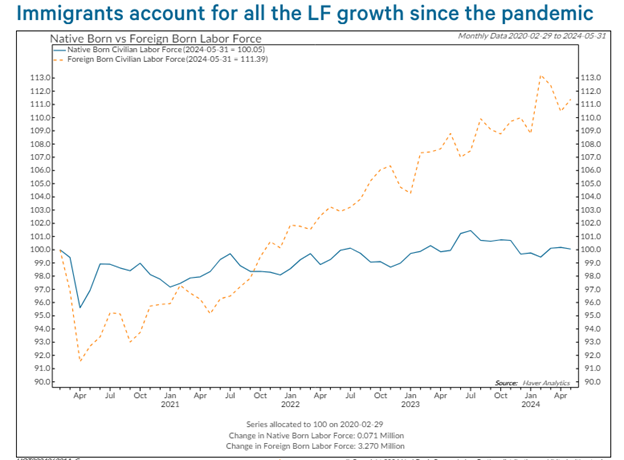
There, I'm done with the debate hoopla! Except, it’s necessary to take a moment to talk about one of the most contentious points of the debate: labor & immigration.
Most of the increase in the labor force since the start of the pandemic has come from foreign-born workers. Since 2007, there have been more immigrants added to the labor force than native workers. Without this imported addition, labor growth is flat. See in the chart below:
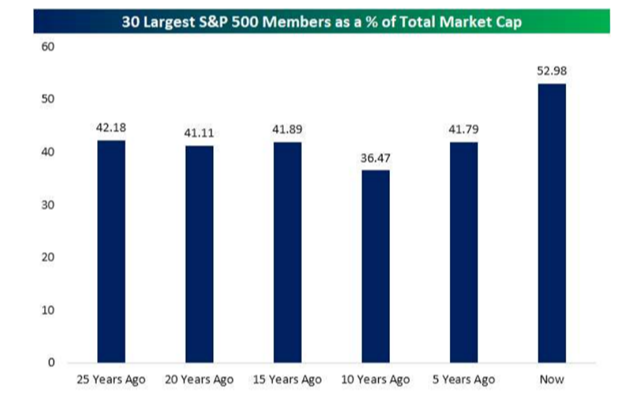
The last major issue the Boo birds keep chirping about is the market being too heavily concentrated on too few issues. As Bespoke Investment Group shows, the 30 largest stocks in the S&P 500 now make up almost 53% of the total market cap. It's even more egregious if we look at only the top 5 or 6. Such concentration does not mean the market has to fall and may even augment gains as long as the top stocks do well. As can be seen below, this is more the rule than the exception as far as the market goes. It cannot be denied that today it is even more concentrated than normal:
NOW TO FOCUS ON WHAT COULD BE EXPECTED IN THE SECOND HALF OF 2024
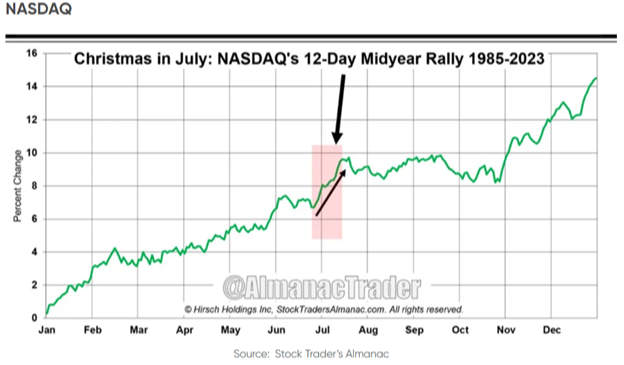
To begin with, if we look at the next two weeks, according to Hirsch Holding's Stock Trader's Almanac, the next two weeks tend to be the kick-off to the mid-year rally to start the second half. According to Hirsch, it is considered, "Christmas In July." After a very stable advance since the beginning of the year, the flat spot in June could be the save up of energy needed for additional new high breakouts:
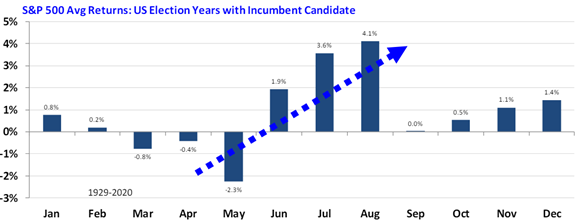
If we look at how July stacks up against other months historically during US Election years, with an incumbent as a candidate, not only does July tend to be exceptionally strong, it seems to be followed by an even stronger August! Going back to 1929 up until the last election in 2020, this is what has been the occurrence:
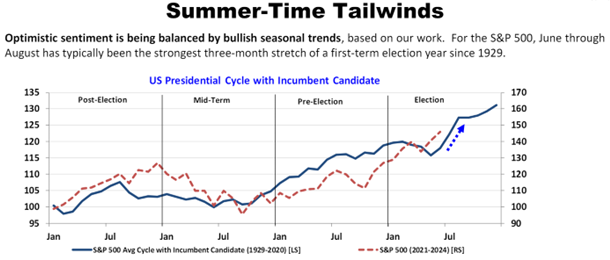
If we stretch this chart out and follow Ari Wald's seasonal US Presidential Cycle, 2024 has followed the average quite accurately going back to the last election! This longer-term chart pattern further exemplifies the strength that could be expected in this summertime period. Ari calls it, "the summertime tailwinds."
To me, if these statistical facts come to be true or at least rhyme to some extent, the next logical question should be, where should an investor focus? To begin with, the leaders in the first 6 months of the year tend to continue their outperformance in the second half. If earnings or economic slowdown raise their ugly head, all bets could be off, but going into our Q2 earnings reports the average increase expected is around 9%. This is a very respectable number given that many are still expecting an economic slowdown due to the rapid increase in interest rates imposed by the Fed.
At present, if one is to simply follow the leaders, it is currently:
- US Equities over Foreign Equities
- Large-Cap over Small-Cap
- Growth over Value.
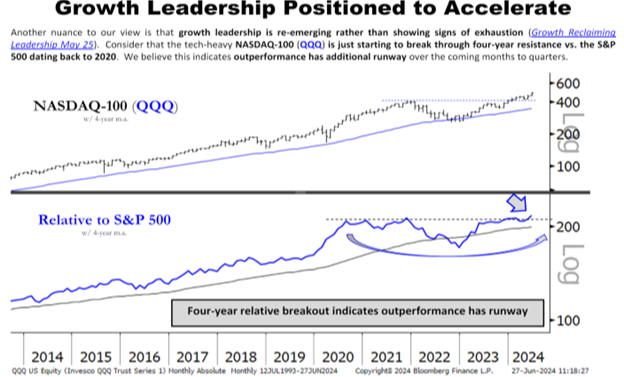
The clearest illustration of all these points is the action of the Nasdaq 100. As can be seen below, not only is this index breaking out to new all-time highs, but (I believe) more importantly, it is coming out of a base it has been building back to 2020 relative to the S&P 500. This is what Ari Wald simply calls "runway." To be clear, this is what we are currently experiencing, and we have shown what statistically occurs during this time of year & election cycle.
Given that the larger growth index as measured by the Nasdaq 100 has been the leader yet measuring this index relative to the broader S&P 500 shows that it has been making a high-level base since its peak in the post-pandemic run of 2020. It seems to be raising its head above this level. This could lead to a fresh breakout.
America has proven that men and women not only can make their history, but they can make it as they please, with circumstances chosen by themselves. Happy 4th of July to you all.
Let’s take time this week to step back and realize just how fortunate we are to live in a time and place where the fire of invention still burns hot, course corrections (however messy they may be) take place, and the future remains as bright as ever. This country is a beacon of hope and freedom for the world.
--
Important Disclosures:
The opinions voiced in this material are for general information only and are not intended to provide specific advice or recommendations for any individual. To determine which investment(s) may be appropriate for you, consult your financial professional prior to investing. All performance referenced is historical and is no guarantee of future results. All indices are unmanaged and cannot be invested into directly.
All information is believed to be from reliable sources; however LPL Financial makes no representation as to its completeness or accuracy.
Investing involves risks including possible loss of principal.
The Standard & Poor's 500 Index is a capitalization weighted index of 500 stocks designed to measure performance of the broad domestic economy through changes in the aggregate market value of 500 stocks representing all major industries.
The Dow Jones Industrial Average is comprised of 30 stocks that are major factors in their industries and widely held by individuals and institutional investors.
The Nasdaq-100 is a large-cap growth index. It includes 100 of the largest domestic and international non-financial companies listed on the Nasdaq Stock Market based on market capitalization.
The Russell 2000 Index is an unmanaged index generally representative of the 2,000 smallest companies in the Russell 3000 index, which represents approximately 10% of the total market capitalization of the Russell 3000 Index.
This information is not intended to be a substitute for specific individualized tax advice. We suggest that you discuss your specific tax issues with a qualified tax advisor.