


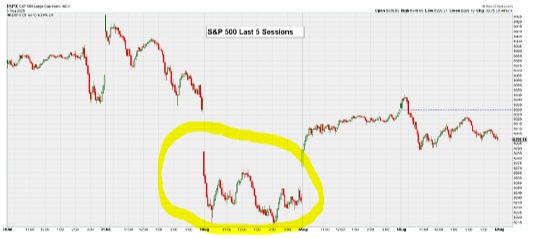
Last week I went into excessive detail about the August / September period and how this “could be” the period where a pullback or digestion could be in the cards. At the same time, it “could be” that Friday, August 1st was it, and we now trade directly higher but that would be a very aggressive assumption I believe.
- A growing number of Wall Street strategists expect a 10-15% correction, which usually means it won’t happen.
- There has so far been no follow-through from last week’s weakness, but the bounce to begin this week could be part of a more complex corrective move.
- Even so, I still believe downside should be relatively limited and would actually welcome another wave lower to add some more exposure.
It doesn’t require fancy degrees or years of experience to identify the fact that the stock market was getting a little overheated recently. The S&P 500, for instance, was nearing levels two standard deviations above the 50-day moving averages, while more than 80% of the NYSE was above the 50-day moving average. Both measures are about as extended as it gets, so it was reasonable to expect some pause or pullback to cool things off. It looked as if that was beginning August 1st and that prompted a wave of calls from Wall Street strategists of an impending correction. Morgan Stanley, Deutsche Bank, and Evercore are among those predicting continued difficulties, with downside expectations typically falling somewhere in the 10-15% range. Pullbacks, of course, are par for the course when it comes to the financial markets. As Jeff Saut of Saut Strategy wrote, the market does not move in a straight line (although it has felt that way lately). Normally, I’d say a 10-15% pullback would be a reasonable expectation considering the S&P ran up more than 30% from the April low to its recent high in just over three months.
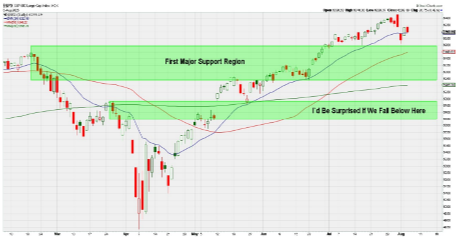
There are two primary support zones I think are worth noting for the S&P 500 -- ~5950-6200 and then ~5650-5800. While it’s possible the index falls below the lower zone, considering how quickly buyers have been swooping in on dips, I would even be a little surprised if the lower region was threatened. If we trade directly higher instead, my existing exposure should benefit, though I don’t anticipate chasing prices higher given that a new high in the SPX would once again take it to overbought levels.
Reading other comments from the smart people on Wall Street, it does give me pause when there seems to be a consensus emerging among strategists that the market will do this or that. I don’t know if we have a consensus quite yet, but I will say in my experience the more such calls I see out there, the less likely they are to happen. That is nothing against the strategists personally. No one gets every market call right. I certainly don’t and often say that if a reader does find someone out there who correctly calls every zig and zag, I will quit doing this and just go follow that person. But usually, the more everyone expects the market to do one thing, the more likely it’s going to do something else.
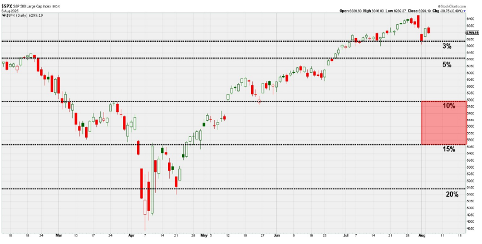
I wanted to take a minute and show what these corrective levels would be on the S&P 500 to give a bit of granularity to the markets action since the February high, to the April low, to today. I do this to simply show lines in the sand based on small percentage differences in decline levels. It now seems that many are expecting some sort of various pullback. So, what would such downside look like from last Thursday’s high? Well, we’ve already gotten a 3% dip, which has been about the extent of the weakness since mid-April. A drop down toward 6100 would give us a 5% loss, which looks quite reasonable and would keep the index around its breakout point from late June when it made a new all-time high. The ~5450-5800 zone, meanwhile, would be the kind of 10-15% correction that some strategists are now calling for. Again, that is certainly possible, but we’ll have to see some major evidence of heavy selling to make it more probable.
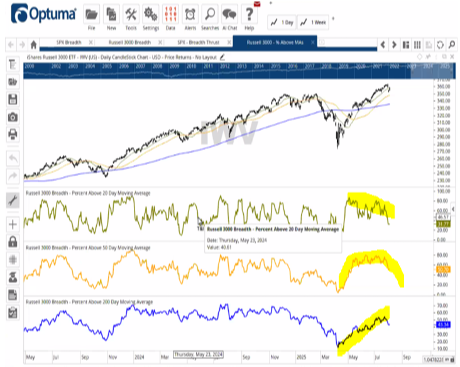
To get a bit more granular for just a moment, I wanted to show what I am seeing that is giving me a slight cause for a pause. In looking at the picture below, the top graphic is the S&P 500 Index. Note that it has appreciated, unabated since the April low. At the very top right, you can see the small 3% blip down that we have experienced in the last week or so. What has gotten my attention is the next three graphics.
- The first one is the Breadth (the percentage of companies going up of the entire index) of the companies in the Russell 3000 Index that are above their 20 days average price. Notice that I have highlighted in yellow the part of the chart that looks like it is sort of rolling over.
- The second one is the Breadth (the percentage of companies going up of the entire index) of the companies in the Russell 3000 Index that are above their 50 days average price. Notice that I have highlighted in yellow the part of the chart that looks like it is sort of rolling over as well. This is a bit longer term, but it also is appearing a bit tired.
- The third one is Breadth (the percentage of companies going up of the entire index) of the companies in the Russell 3000 Index that are above their 200 average price. Notice that I have highlighted in yellow the part of the chart that looks like it has broken the tight area that it has progressed in at an upward slant since April. This is the longest term I tend to look at and it tends to be the one with the least volatility.
In looking at the seasonal work that I have been writing about almost weekly since the beginning of the year, it can be seen below that August tends to be a difficult month. I really don’t know what black swan is lingering out there to prove to be the catalyst for this August summer hiatus, but this is what the chart looks like if history is again to be a gauge of what to expect:
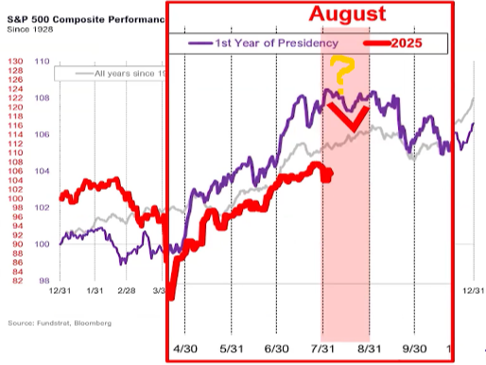
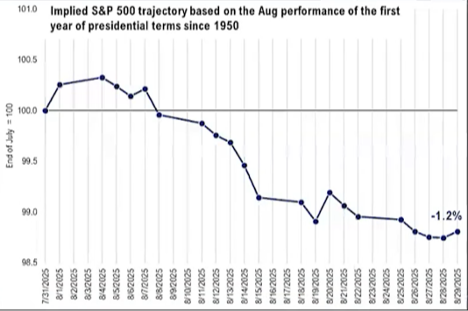
In taking the first year of a new Presidential term into consideration, going back to 1950, below is what the month of August looks like. If looking closely, this week “should be” the acceleration to the downside week of an expectedly negative month. I am not saying this is what seems to be playing out, but rather to say that this historical precedent along with fears of a strange CPI and or strange PPI print, or bad retail sales could all add up to a tough time into this Friday’s monthly option expiration.
The next point that I feel must be addressed is President Trump’s comments about interest rates and his motivations to replace “Jerome Too Late Powell.” This is really quite an interesting point to examine. On one hand Trump’s methods are to get out in front of a prospective negative economic situation, and Powell’s methods are, as he says, to be data dependent based on facts that are reported, while knowing that they represent the recent past.
I tend to see it a bit differently but appreciate what Trump “wants” to accomplish as well as what Powell feels is his high probability reactions to the direction of the economy. I look at interest rates in the market and let the market tell me what it is expecting. My primary measure is the 10-year US Treasury as it reflects the direction of mortgage rates and corporate lending. It also looks like this interest rate is heading lower once again, though who knows if this move will end up being for real or just another fake out. The 10-Year U.S. Treasury yield remains stuck within the large range it’s been in since late 2023. It has made potential breaks on both the upside and downside in recent months, but each time the move soon reversed just as it was getting going. Yet, in the last two weeks the economic indicators have shown a recognizable slowing in the labor markets and measures of growth in the broad economy. This has translated into rates declining in the short run. The rates seem to be stuck in a tight range that I have bracketed in a red bar on the high side and a green bar on the low side going back to late 2023. I have then put some short-term focus on the most recent activity with a triangle pattern having formed and the rates have now moved below this lower line of the triangle.
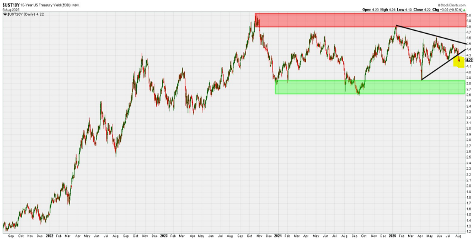
Will this result in another move down to the green bar at around 4%? This I believe will be dependent on the next set of economic indicators. It will not depend on the current earnings environment because earnings are coming in more strongly than expected and therefore showing strength in the economy.
This to me is what could dictate the next move for the equity markets. There was a huge run up from late 2023, then the first presidential year cycle lows, then a recovery since the tariffs and new policies did little to negatively affect the overall economy, and now we are in a sort of holding period. This matches perfectly with an expected August / September tough period. But if history continues to dictate what could be expected, based on earnings and earnings forecasts of corporate America, we should come out the back side of this period to the upside.
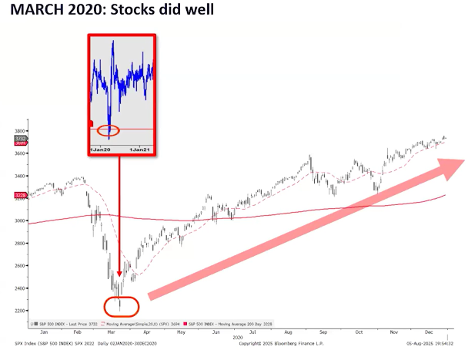
Many seem to be hoping for this 10-15% digestion. I believe that they are the ones that have missed then entire move up from the April lows and are desperately hoping for a chance to get back in. Thomas Lee presented what I found to be a very interesting graphic on Goldman Sachs’ Prime Brokerage positioning of institutional managers. It appears that there has been another mass exodus under the surface by these institutional traders much like what was done during the COVID crisis in 2020. This proved to be a very bad decision as I point out in the next slide. Please see the Goldman comment below, followed by what the market’s action was just following their last run for cover.
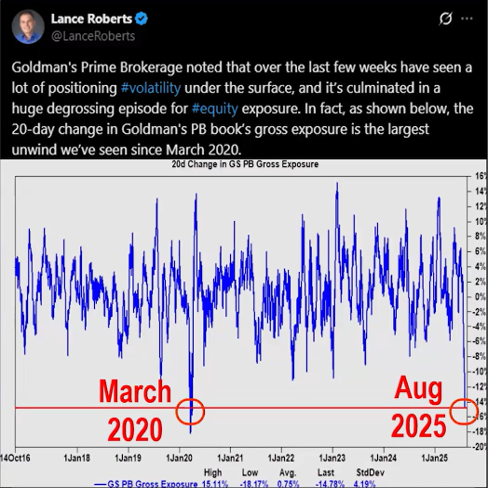
Here is what happened after the March 2020 exit:
I do not attempt to handicap expectations, I instead try to weigh historically relevant consistencies, coupled with my cyclical work and then try and see what extent current anomalies are present. This is why I am happy with the action of the portfolios but cautious based on what August and September tend to do. My work hit a high point on July 11th and has been in decline ever since, again, even while portfolios have continued to advance. As for current anomalies, I primarily am focused on the amount of cash on the sidelines and the prospects of Fed induced changes in interest rates. The media seems to be fixated on the tariffs, yet I cannot find any tariff causing effects on corporate earnings or consumption patterns. Until these raise their ugly little heads, I believe that paying attention makes sense but there has been no action to take.
In closing, this week sort of closes out the second quarter earnings season for S&P 500 companies as we only are expecting six companies to report this week. With 91% of the companies having reported, profits are up 11.4%, from a year earlier on revenue growth of 6%. Forbes put expected earnings growth at 4.8%. Looks to me like Trump and his highly challenged policies seem to be doing more good than bad.
- Ken South, Tower 68 Financial Advisors, Newport Beach
-
Get Ken's Weekly Market Commentary Delivered To Your Inbox!
Important Disclosures:
The opinions voiced in this material are for general information only and are not intended to provide specific advice or recommendations for any individual. To determine which investment(s) may be appropriate for you, consult your financial professional prior to investing. All performance referenced is historical and is no guarantee of future results. All indices are unmanaged and cannot be invested into directly.
All information is believed to be from reliable sources; however LPL Financial makes no representation as to its completeness or accuracy.
Investing involves risks including possible loss of principal.
The Standard & Poor's 500 Index is a capitalization weighted index of 500 stocks designed to measure performance of the broad domestic economy through changes in the aggregate market value of 500 stocks representing all major industries. The S&P 500 is a stock market index tracking the stock performance of 500 of the largest companies listed on stock exchanges in the United States. Indexes are unmanaged and cannot be invested in directly.
The Dow Jones Industrial Average is comprised of 30 stocks that are major factors in their industries and widely held by individuals and institutional investors.
The Nasdaq-100 is a large-cap growth index. It includes 100 of the largest domestic and international non-financial companies listed on the Nasdaq Stock Market based on market capitalization.
The Russell 2000 Index is an unmanaged index generally representative of the 2,000 smallest companies in the Russell 3000 index, which represents approximately 10% of the total market capitalization of the Russell 3000 Index.
Data sourced from Bloomberg (2025).
Stock investing includes risks, including fluctuating prices and loss of principal.
Bonds are subject to market and interest rate risk if sold prior to maturity. Bond values will decline as interest rates rise. Bonds are subject to availability, change in price, call features and credit risk.
Government bonds are guaranteed by the US government as to the timely payment of principal and interest and, if held to maturity, offer a fixed rate of return and fixed principal value.
Bond yields are subject to change. Certain call or special redemption features may exist which could impact yield.
International investing involves special risks such as currency fluctuation and political instability and may not be suitable for all investors.
Alternative investments may not be suitable for all investors and should be considered as an investment for the risk capital portion of the investor’s portfolio. The strategies employed in the management of alternative investments may accelerate the velocity of potential losses.
This information is not intended to be a substitute for specific individualized tax advice. We suggest that you discuss your specific tax issues with a qualified tax advisor.
LPL Tracking #782396