


Different tone
As I mentioned last week, third quarter earnings season picked up where Q2 left off, with a historically high beat rate and minimal downward revisions for the rest of calendar year 2025. Earnings were up over 13% verses last year and this does not usually portend for negative economic situations. Also, the forecasts (which during earnings report prove to be even more important that what “has been” reported) are stronger leading into 2026.
Yet, the market reaction has felt different. Whereas prior massive AI spending, both on AI itself and on AI infrastructure, announcements were cheered, some recent ones have been met with skepticism. Widespread discussion over whether the AI boom has entered a bubble phase like dotcom stocks in the late 1990s likely played a role. Jay Powell’s caution against a December rate cut being a foregone conclusion is another. Based on our relative strength studies, we are maintaining our overweight recommendation for U.S. stocks versus bonds and cash, along with our preference for large-cap Growth. Valuations suggest that the risks to the bull market increase as the calendar turns to 2026. This all hinges off of the expected 2026 earnings progression.
Positive message from negative seasonals & May-Oct 2025
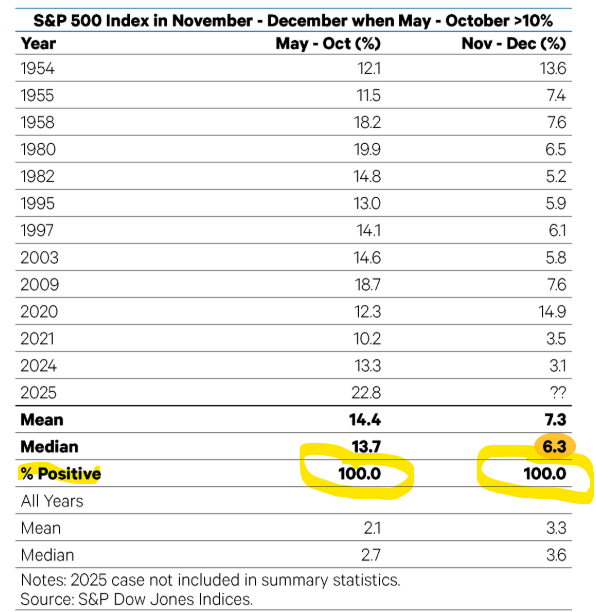
Seasonality is referenced and respected although it tends to not lead our thinking. It can be a useful guideline if it aligns with other indicators. A case in point is that this year the “sell in May and go away” strategy failed miserably. Not only did the S&P 500 rise each month from May through October, but the 22.8% gain was the strongest since 1942. We have been overweight U.S. stocks during this time as our models were giving even a more bullish message than the seasonals.
Do strong sell in May periods pull gains forward or foreshadow further upside? Since 1950, when the S&P 500 has gained at least 10% from May – October, the benchmark has risen 12 out of 12 times from October 31 through December 31 by a median of 6.3%. Which brings us to today. We are faced with a new question, “If they Buy in May, is it better to stay?” This is a pretty impressive statistic as I see it. Going all the way back to 1950 with a 100% probability I believe should be respected considering that there were many different global and domestic political differences to today. Here is the table:
Captains of the Obvious
One of the catalysts for last Tuesday’s 1.2% drop in the S&P 500 and 2.0% plunge in the Nasdaq was that Goldman Sachs CEO David Solomon and Morgan Stanley CEO Ted Pick warned of a 10% or greater pullback next year.
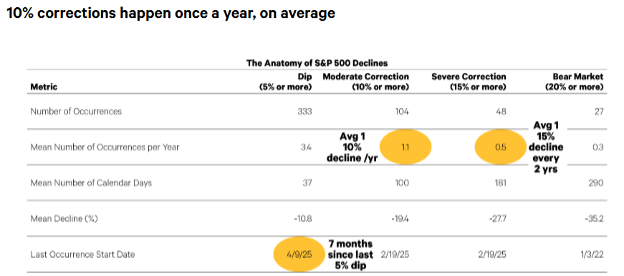
My initial response to the comments was to reach for our anatomy of stock market declines study. The study has shown that the S&P 500 averages one correction of at least 10% every year. So their comments are just stating historical norms! A more astute observation would be that the last 5% pullback was nearly seven months ago, the longest stretch since October 2020 – September 2021. See the table below which gives complete data on 10% corrections. It can be seen that there were 34 in total. The number of days that it takes for them to exhaust themselves is around 37 days and their decline tends to average a -10.8%. It is also worth noting that the last one was during the Tariff Tantrum on 4/9/25. See table below:
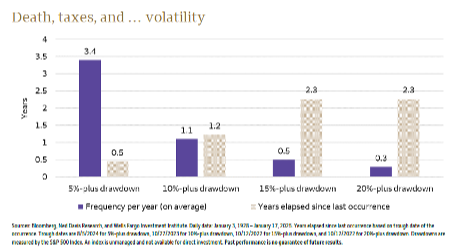
Their statements were not notable for the facts but rather that they felt compelled to say them in the first place! They reflect an unease amongst Wall Street veterans about how AI-related companies are dominating the economy and financial markets. In the absence of government data, massive layoff announcements during earnings season – with AI (supposedly) as the reason – have created an eerie feeling that the economy has grown too dependent upon a capex spending spree with limited visibility on the return on the investment. Market reactions to Meta and Palantir’s earnings are two cases where better-than-expected earnings were trumped by concerns about forward spending plans and valuations. Taking this one step further, I want to share, as I often have, the statistical frequency of 5% drawdowns, 10%+, 15%+, and over 20%. Please save this chart as this tends to provide a clear beacon in the midst of a corrective storm:
The point that I am trying to pound out is that in the absence of anything truly negative in the case of a sort of “Black Swan” the markets are doing simply what markets do. This is what has happened regardless of the environment. What we are dealing with “this time” is clearly packed full of many meaty tidbits that the media has been able to sink its teeth into. I want to take a moment and focus on these and then close with some of the expectations that are being expressed by the smart folks at FundStrat, and why this could quite possibly be just a pause to refresh.
The problems:
- Private Debt cockroaches
- Prop 50 in California
- Socialist Communist Governor Mamdani in New York
- Valuations
- Breadth breakdown
The Roaches:
We have been enjoying a rather ebullient expansion due to many factors, but one of them that I attempted to really explain is the vast amount of cash on the sidelines. This cash came as result of US Government helicopter money drops following the Great Financial Crisis and Covid. Currently this sits somewhere around $7.7 Trillion. At the same instant, due to the blow up in the financial system in ’08-’09, many more restrictive regulations were placed on lending institutions. These regulations continue today. As a result, a “shadow lending” plethora of money has arisen in the form of “Private Equity” and “Private Debt.” Both of these lack regulation and oversight. When there isn’t regulation, improper things are sure to happen. Hence, cockroaches.
I don’t believe that this is of a level that could topple our financial markets, but rather is happening at a time when sensitivities are very high as are market levels and valuation levels.
Prop 50 in California:
California democrats, in an effort to keep and increase the number of seats, they put through proposition 50 which redistricts much of California. This could get them as many as 5 new seats. Now, this in and of itself means little in the overall financial markets, but it is a testament to changes in behaviors towards the current administration and its overall control in government. This happened at the same time as the historic elections in New York.
Socialist Communist Governor Mamdani in New York:
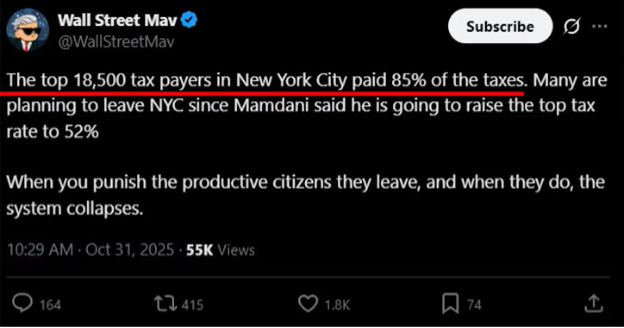
I will leave the research up to each of you individually, but this is not an uncommon occurrence in New York. Think back to Giuliani and Bloomberg. The city was flourishing, yet the separation between the elite and the middle / lower class reached a breaking point. This appears to be the situation in New York currently where it is simply unaffordable for most people to live and work there. Fixing rent prices, government grocery stores, free transit. All shout communism, but in reality they are a manifestation of the frustrations of the broad population there. I don’t mean this to say that things should be price fixed or free, but rather that I understand the arguments. The problem really comes when the elite exit from the city and the tax receipts evaporate. This is a twitter post relative to this:
And here is a cartoon about what is happening in New York:
Foreign-Born Population of New York City is approximately 36% of NYC’s residents. This is the same pattern that was unfolding in Rome, which was the first city in the world to reach a population of 1 million. The fall of Rome was dramatic, and immigration began to pour in, and it was not until the Victorian Era when London would reach that 1 million mark.
A quote that I recently read from Armstrong Economics, “In 1940, the White population of New York City stood at over 90%. By 1970, that was down to 62%. Ten years later it fell to 51% in 1980 then in 1990 it dropped sharply to 43.2%. The by 2000 the White population plunged to 35% and now by 2025 it is estimated to be about 17%. It has been postulated that Mamdani intends to engage in “racist economics” and wants to impose higher taxes on the White Community. These people refuse to learn from history. The failure of communism in most countries is attributed to economic inefficiency and suppression of individual initiative, which together stifled innovation and productivity. If people are punished for innovation and demonization like J.P. Morgan and Henry Ford because they simply made a lot of money, then there would be no economic growth.”
Clearly, it is yet to be determine, the ultimate outcome, but in Barron’s last weekend it was made blatantly clear that many of the promises that Mamdani made lie far beyond the juristiction of a mayor. Many, like free transit are up to outside and indepent transit authority organizations.
Valuations:
Global economic growth remained on solid footing at the start of the quarter, according to the latest global PMI’s. The global compaosite (services and maufacturing) PMI, a monthly proxy for global GDP rose to 52.9, matchin its highest level since May 2024. This puts the indicator further away from its recesssionary threshold of 47.8 and even slightly above its long-term average. Accelerating global economic growth, as depicted by the three-month change in global PMI, is associated with strong gains in global equities.
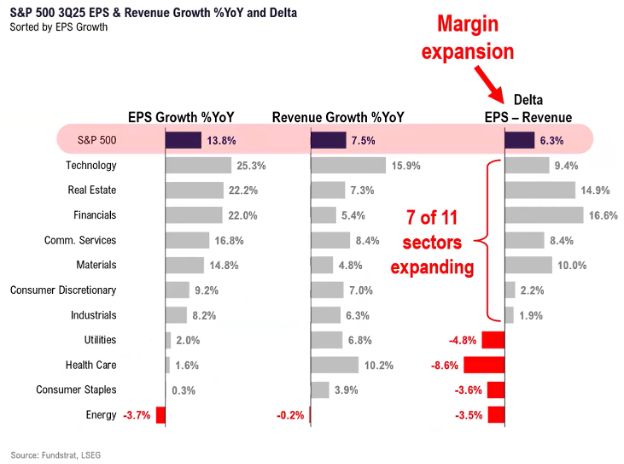
Bringing this analysis stateside, as can be seen below, although valuations may seem stretched from a P/E analysis, expansion is still in place and this could be turbo charged based on two back to back interest rate cuts:
Breadth Breakdown:
Selling pressure as per the price/volume action of the NASDAQ Composite has pushed the some models into a defensive cash signal. Global liquidity remains intact, but we could see continued short-term weakness in the major averages. The situation remains fluid though if history is any guide given the strong liquidity flows, earnings, and GDP, markets will see new highs but it may take time.
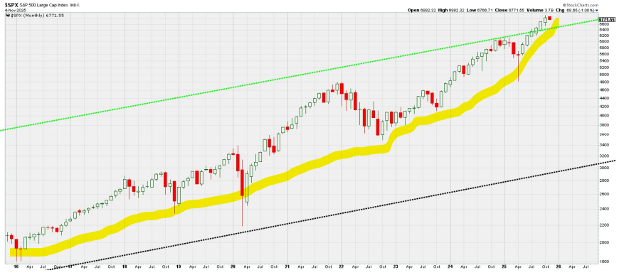
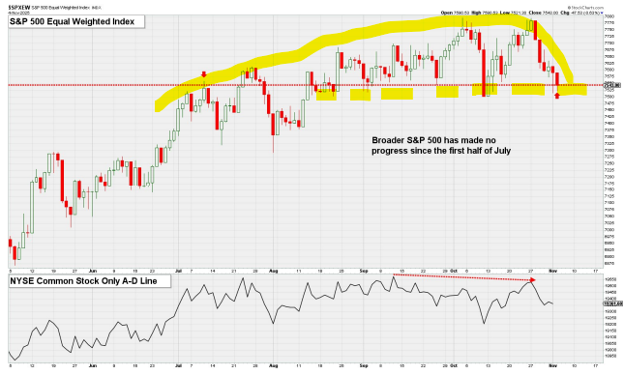
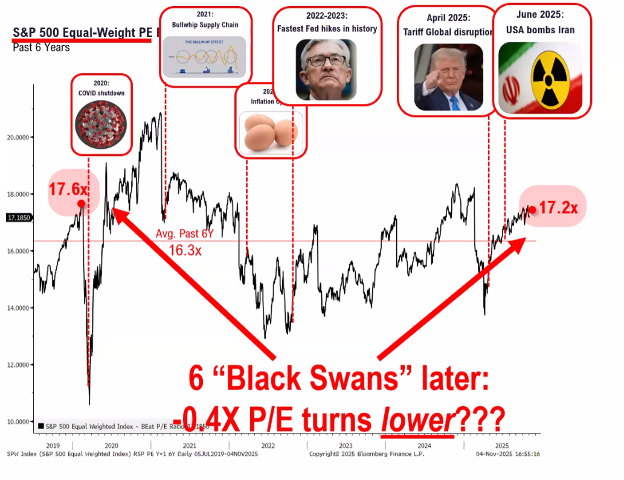
The divergence of the S&P 500 (which is 35% concentrated in 7 companies) and the equal weighted S&P 500 (which gives every one of the 500 companies an equal vote) obviated one point. The broad market is in a difficult hinging on negative situation, where the leading technology companies continue to grow. The question is when does this growth hit a critical mass where there is just no more “there” there. Below is a graphic illustration of this phenomenon. Note that the first chart is the normal, capitalization-weighted S&P 500 and the one below it is the equal weighted S&P 500. I have put a yellow line to show the complete difference in how the two are acting.
This has been what I find to be the most relevant argument. In a nutshell, it is great that the big dogs are leading the pack, but this can only happen for so long until either the big dogs take a rest or the remainder of the pack catches up. This still has yet to resolve itself, yet as I started this note, it is not uncommon for the big dogs to take a rest at least a few times a year, and a winter’s nap less often, but for a longer time! At present, looking at overall P/E ratios, it can be seen that we are really just right back at where we were. And this is after 6 other “black swans” that were not only avoided by digested by the markets:
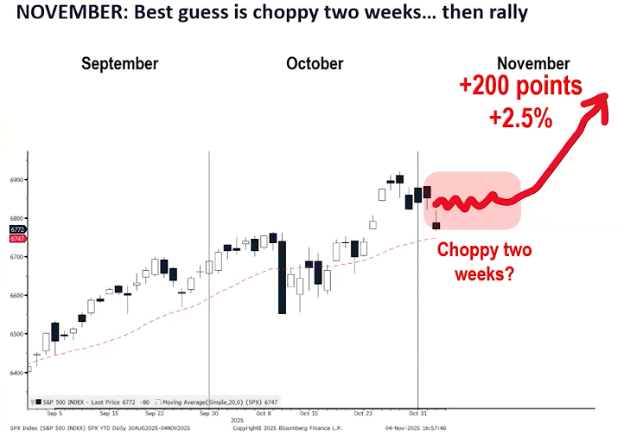
In the end, it is a function of earnings, earnings progression, and available liquidity. The Fed has been reducing reserves at the same time as they are lowering interest rates. This is their attempt to slow down the growth of our domestic debt. This tends to be quite negative for stock prices as it sucks the oxygen out of the room. According to Thomas Lee of FundStrat, this first few weeks of November could be a bit rocky, and this would align itself with statistically normal and seasonal digestions, but in the end he sees the markets continuing their advance into the beginning of 2026:
Only time and earnings will tell, but if the government shutdown exhausts itself, as Tom Block of FundStrat says below, many of the unknowns are now knowns and things could progress in the normal direction they have been travelling. See Tom’s comments below from Monday:
As the saying goes, “We live in interesting times.” I don’t know if they are ever really uninteresting, but clearly they have got everyone’s attention today! Here is where we sit currently, and how the markets have reacted at previous lows this year. I include this to give perspective on how truly subtle this pullback has been, and how this past Friday’s low has been a very common occurrence this year.
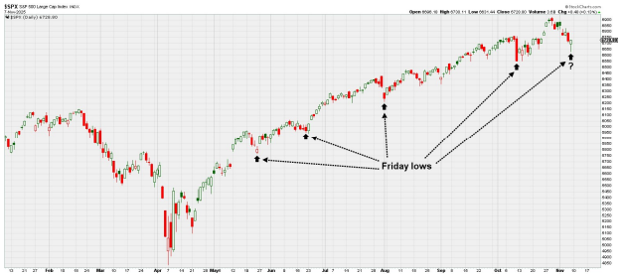
When we add it all up and put it within the context of what has come before during this rally, I believe there's already enough in place for Friday to mark another low. Even if that turns out to be wrong, and stocks roll back over, I still believe any subsequent near-term weakness would likely be relatively contained. Some big banks and pundits are calling for a 10-15% correction in the SPX here. While that would still be a perfectly normal pullback, it would likely require the broad market to become extremely oversold given how much damage has already been done.
- Ken South, Tower 68 Financial Advisors, Newport Beach
-
Get Ken's Weekly Market Commentary Delivered To Your Inbox!
Important Disclosures:
The opinions voiced in this material are for general information only and are not intended to provide specific advice or recommendations for any individual. To determine which investment(s) may be appropriate for you, consult your financial professional prior to investing. All performance referenced is historical and is no guarantee of future results. All indices are unmanaged and cannot be invested into directly.
All information is believed to be from reliable sources; however LPL Financial makes no representation as to its completeness or accuracy.
Investing involves risks including possible loss of principal.
The Standard & Poor's 500 Index is a capitalization weighted index of 500 stocks designed to measure performance of the broad domestic economy through changes in the aggregate market value of 500 stocks representing all major industries. The S&P 500 is a stock market index tracking the stock performance of 500 of the largest companies listed on stock exchanges in the United States. Indexes are unmanaged and cannot be invested in directly.
The Dow Jones Industrial Average is comprised of 30 stocks that are major factors in their industries and widely held by individuals and institutional investors.
The Nasdaq-100 is a large-cap growth index. It includes 100 of the largest domestic and international non-financial companies listed on the Nasdaq Stock Market based on market capitalization.
The Russell 2000 Index is an unmanaged index generally representative of the 2,000 smallest companies in the Russell 3000 index, which represents approximately 10% of the total market capitalization of the Russell 3000 Index.
Data sourced from Bloomberg (2025).
Stock investing includes risks, including fluctuating prices and loss of principal.
Bonds are subject to market and interest rate risk if sold prior to maturity. Bond values will decline as interest rates rise. Bonds are subject to availability, change in price, call features and credit risk.
Government bonds are guaranteed by the US government as to the timely payment of principal and interest and, if held to maturity, offer a fixed rate of return and fixed principal value.
Bond yields are subject to change. Certain call or special redemption features may exist which could impact yield.
International investing involves special risks such as currency fluctuation and political instability and may not be suitable for all investors.
Alternative investments may not be suitable for all investors and should be considered as an investment for the risk capital portion of the investor’s portfolio. The strategies employed in the management of alternative investments may accelerate the velocity of potential losses.
This information is not intended to be a substitute for specific individualized tax advice. We suggest that you discuss your specific tax issues with a qualified tax advisor.
The economic forecasts set forth in this material may not develop as predicted and there can be no guarantee that strategies promoted will be successful.
LPL Tracking #824173