


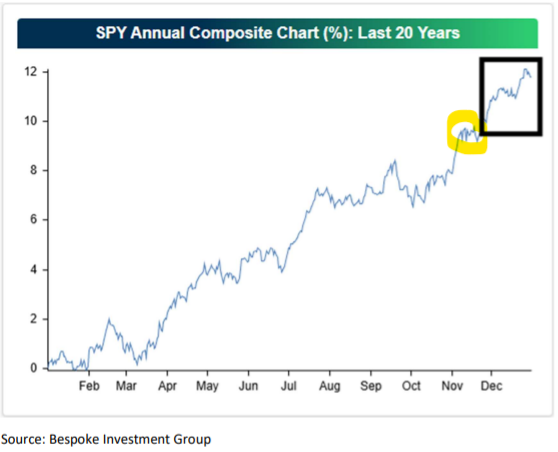
I have been writing over the last few weeks that this market could be a bit difficult in November and that it appeared that there could be some negative moves, sometimes violent before the normal end of year rally. There are a number reasons why there could be an end of year rally, but I will leave that for December commentary. What we originally felt might be a bit of a “whipsaw” market instead has sort of turned into a more defined “whiplash” market. I find it encouraging that the market did not fall completely apart once the S&P 500 began its digestion. To refresh memories on what the last 20 years have shown on an annual basis, please see below. Note in the yellow circle what we have been dealing with of late, and the box around what has happened normally in the last month:
Until the markets make a definitive decision as to where they are heading next, we will let nature take its course. Buyers have stepped in time and time again during this rally (as can be seen above), yet we still need to be prepared for a scenario in which prices accelerate lower on a break below obvious support levels rather than immediately getting bid back up. Holiday weeks such as this one are always sort of a crapshoot. Historically, seasonality has been positive from now through the end of the year but less so over eh past few years due to the strength seen throughout the earlier part of the years. I continue to believe that probably a good chunk of the pullback have been seen but it almost “feels” like it needs to go a bit lower before a final bottom is made. According to the tea leaf reading of Mark Newton of FundStrat, this could last till around December 15th, roughly another couple of weeks.
In Up & Down Wall Street there was what I feel was a very salient commentary by Mohamed El-Erian. El-Erian very simply said, “We’ve thrown absolutely everything at it (referring to the US equity market), including a government shutdown, and yet it doesn’t skip a beat.” I mean think about it, give me one, I mean just one thing that the media has been amping about that the market hasn’t overcome! Tariffs, shutdowns, wars, Epstein & Larry Summers (give me a break already), pretty much almost more than one can count, and still, the GDP is up 3.8% in the second quarter and probably going to see 3% in the third quarter, so it’s an incredibly resilient economy and it speaks to the entrepreneurship and dynamism of the private sector. El-Erian went on to say, If you had told me at the beginning of the year, with all the shocks we’re going to get, we would deliver the growth we have, I would say ‘well, maybe one quarter.”
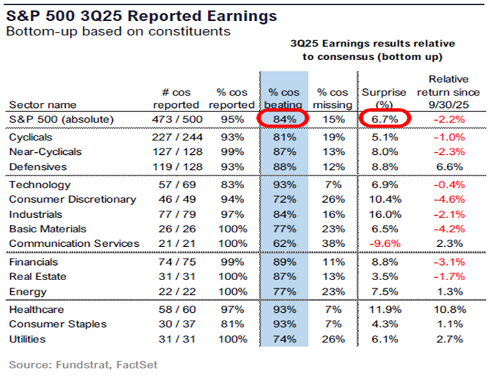
What I am trying to jump up and down and scream about is the fact of “ENTREPRENEURSHIP AND DYNAMISM” of the private sector. To me, the greatest illustration of this was the Tariff Tussle. Think about it. When Trump ran his campaign, he said that this was what he was going to do. As his lead in the election became more evident, corporate America, both in manufacturing, middle markets and sales adapted. When the tariffs were imposed, they were prepared! And how did the tariffs affect earnings and revenues? They didn’t! Because of the dynamism of the US and our business models. So, this brings us to today. How are we now, at the tail end of earnings for the third quarter? See chart below but recognize that we experienced the 9th straight quarter of double-digit earnings growth, higher than expected forecasts and in the face of falling inflation, slow employment growth and an unemployment rate of only 4.4%. Sounds like Goldilocks is in the house to me.
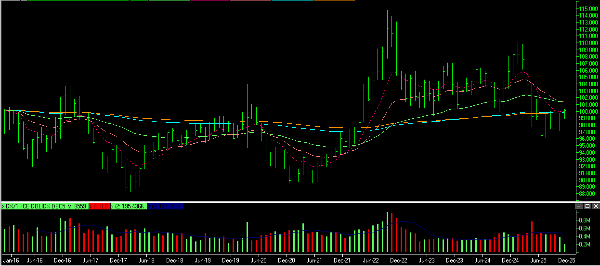
What industry in general has a hard time adapting to is the unspoken hand of the economy. This is in the form of liquidity, cost of funds, and trade issues based on currencies. This is why I continue to talk about the importance of currencies and interest rates. As can be seen below, the US Dollar has sold off from highs seen January 2025, but for the most part it is extremely stable. Could this be why the risk-on new asset class of crypto has recently gotten whacked? Could it be that the run in gold, the strongest in 50 years might be time for a breather? See the chart below of the US Dollar. Note that we are in exactly the same place we were in 2016:
Now to interest rates. The Fed is adjusting the short-term rates. They do this to add oxygen or fuel to industry and the consumer. If they lower rates, money is cheaper to borrow so profit margins expand and consumers can buy more for less. El-Erian went on to say, in regard to the Fed, “Thinkabout how absurd their statement is. Monetary policy acts with long and variable lags. That’s what we’ve learned. Data captures the past. So, you’re telling me that I’m setting policy for some outcome in the future based on data of the past. Unless I complement that with some strategic view of where we’re going, I am going to be continuously late. And I think that we’ve seen the Fed continuously late. They were so late in responding to the inflation surge of 2021. It is a miracle that we didn’t fall into recession. I remember Chair Powell in August 2022 warning about pain. I remember Bloomberg going with a headline that said ‘100% probability of recession in 2020,’ and that didn’t happen.” The Fed is driving while looking in the rear-view mirror on a windy road.
On one hand they really don’t have an option other than to forecast which requires a bit of a crystal ball, but this is why whenever the Fed does or says something, I ALWAYS, LOOK AT THAT 10-YEAR US TREASURY YIELD RESPONSE. Why do I look at the 10-year Treasury? Because this reflects the changes in the mortgage markets. Real estate is the biggest industry in the US and therefore, as far as I’m concerned, is a bit of a canary in a coal mine for what to expect in the next 12-18 months in the economy from a growth rate perspective. Since the average holding period of a residential residence is 7 years, mortgage rates are based off this instrument. Note below that the 10-year interest rate is at exactly the same place it was in late 2022. The economy is in a very different place than this now.
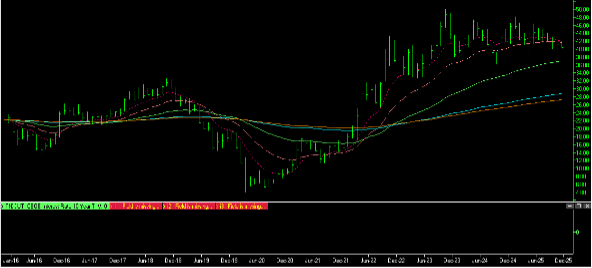
What I do find interesting is that the Fed has cut twice, and are talking about cutting again next month, but the 10-year yield is not changing. When they cut twice, the rate wasn’t falling. I believe it would have been falling if the market thought the economy was slowing. So, when rumors of the Fed cutting again start to heat up, the yield starts to go up. This implies to me that the economy is very healthy and that if the Fed cuts again this could be inflationary. Inflation is something that the economy and our debt load can’t afford. If we look at the employment picture that we got last week, there were 119,000 jobs added when only 50,000 were expected, and the unemployment rate came in at a very healthy 4.4% (still very low, even after DOGE, immigration, and the shutdown). The economy is quite strong, or at least on a very digestible growth curve of around 3%.
El-Erian finished with what I feel is super important. He believes that the investors should focus on world economies, not just our own, what he calls a “world of geoeconomics.” He said, “For a very long time, economics was driving the bus, now, economics is lucky to be in the back seat (I think this is a little bit too strong). Decisions are being made according to national security, geopolitics, and domestic politics. What investors have to realize is that economic outcomes will have less to do with economic logic and commercial logic.” I believe this is why global equity markets are in an advance even though Germany, Spain and Japan are having the problems that they are, and the emerging markets are experiencing a robust rebirth due to natural resources and a huge supply of inexpensive labor.
What is this market saying and dealing with?
This market is a very very strange market. Before I go into “why” I find it strange, let me share a few fairly glaring similarities I am seeing. To begin with, let’s look at the “AI Bubble.” Is there a bubble? I don’t think so. If we look at all the companies in the food chain of AI they are all tremendously profitable, virtually debt free, no major encumbrances of plant and equipment cost, and a small number of employees. So back to the similarities. This AI situation is being compared to the Dot Com bubble of 2000. The differences I find are quite glaring, but the reason why it sticks in investors’ minds is that they still have the burns on their hands from touching the radiator back then. If we harken back to 2000, there was no previous technological comparison of overvaluations in technology to this magnitude. Today, we remember, vividly, what it felt like and don’t want to feel it again!
The next major similarity is the debt issue. Even more recent was the debt debacle of the Great Financial Crisis of ’08-’09. Now we have the “Private Debt Debacle,” better labeled as the Jamie Dimon “Cockroach Recognition.” So far, the only things published are the three that were publicized by Blackrock, all of which I mentioned in the past few newsletters. But the most recent issue that I am very surprised hasn’t been discussed in great detail is the merging of the private debt of Blue Owl Capital with their publicly traded fund. WOW! Wait a second. Now, without shareholders having a say, all of Blue Owl’s non-regulated private debt is being merged into all the other more high quality investments? This is astounding to me and smells just like the mortgage pools that were packed full of non-rated consumer debt in the financial crisis. This was when the pension funds thought they were buying highly rated mortgage pools but instead a sizable percentage of the pool was “junk” debt, like used car loans.
The reason I bring up the debt issue is that this is what I believe is the catalyst for the most recent market correction / digestion. Is it going to manifest itself into something far more damaging in the markets? I really don’t think so. As Rich in my office so eloquently put it, “Everybody remembers vividly what it felt like to touch a blazing hot radiator and they don’t want to do it again!” Hence this pullback, which by the way makes this the worst November performance going all the way back to 2008 should end up being nothing more than just the typical seasonal digestion. Please, as I’ve said numerous times, print out the chart below.
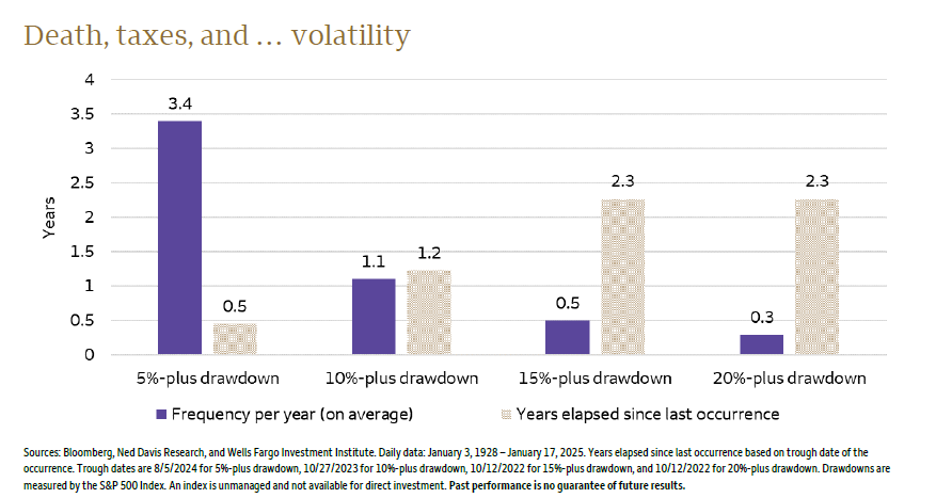
5% drawdowns in indexes tend to occur around every 6 months. Well, the last drawdown was in April, so here we go. As of the end of last week we are somewhere around 7% off of highs.
So, where are we today? The S&P 500's tendency has been to dip down to relatively high support levels before sharply reversing back upward. Then again to rise until overbought extremes are reached (reference the last 20-year chart above). Then we would turn around and do it all again. This is the clear illustration of the AI space as this ETF actually has it in its title. I bring this up for illustration purposes only. The selling has also continued to feel rather mechanical and orderly rather than a mass flight to safety. In other words, it still feels more like another dip to me than a legitimate reversal of the trend. That could change if the selling continues, but the S&P is now getting down to the 5-7% pullback range
I’ve said is probably the extent of what we should expect in the near term. For now, I am not sure there’s much of a clear edge in either direction, though I am growing more constructive as sentiment turns more negative. If the debt situation should spread deeper I would have to rethink my optimism. Ned Davis Research showed in last Wednesday’s report, sentiment is mixed. Long-term valuations and positioning suggest excessive optimism, but shorter-term investor and consumer surveys show more pessimism. The NDR Daily Trading Sentiment Composite fell into the extreme pessimism zone at just 23.3 on November 20. Historically, readings below 20 have been good at marking short-term bottoms in the market, but the 23.3 reading may be close enough.
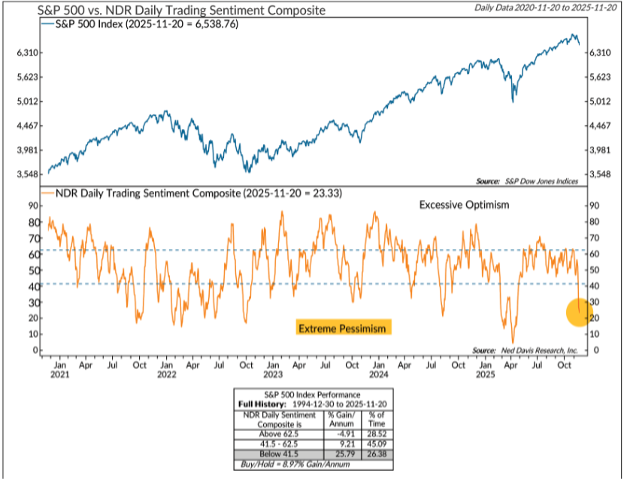
The last time it fell this low was in February of this year, before the Liberation Day announcement. The market and sentiment fell much further then, driven by the worsening news on tariffs. In the absence of a similar selling catalyst, this pessimism should help set the stage for an end-of-year rally.
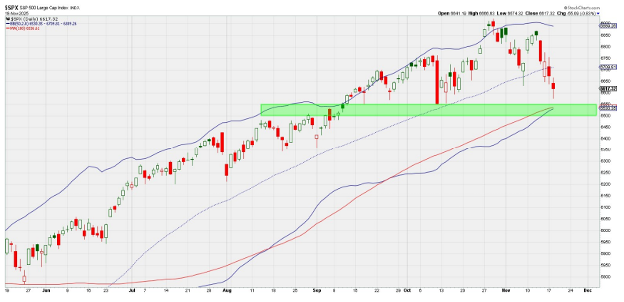
Now I want to look at the S&P 500 specifically as a more broad interpretation of the US financial markets. S&P 500 is nearing an important zone. The S&P 500 had declined a little over 5% from its recent high at its low last week, which is still a relatively small dip in the grand scheme of things. However, that damage is enough to already take the index to what could be a massively important support zone around 6500-6550. Please reference the picture below. The importance of 6550 is obvious considering it held as support on three previous occasions in September and October. But the whole zone around 6500-6550 (which I have highlighted with the green horizontal box) has been something of a pivot point going back to August when it initially acted as resistance (a place that the market had difficulty getting above). Besides the horizontal price support, there is also the 100-day moving average and the band two standard deviations below the 50-day moving average in this 6500-6550 area. When we add it all up, it is certain that plenty of eyes will be on this region, increasing the chances of some “squirrely” action that can shake out some traders.
Sentiment / Valuation has concerns, but so far, unlike those seen at major peaks
I’ve rarely seen crowd sentiment this mixed at record highs in stocks. As I’ve noted many times, valuation and positioning are at near-record highs, thus high risk. Investor sentiment surveys mixed. Other measures of crowd psychology are more mixed or even show extreme pessimism. I brought this up last week with the AAII survey studies. When one looks at a survey from the AAII, we are in a many-month-long zone of extreme pessimism, which has historically led to double-digit hypothetical gains. Even more confusing, this is from the very same group of investors that are heavily invested in the market. So heavily invested in fact that we are at optimism extremes in this measure. I never said this was an easy business!
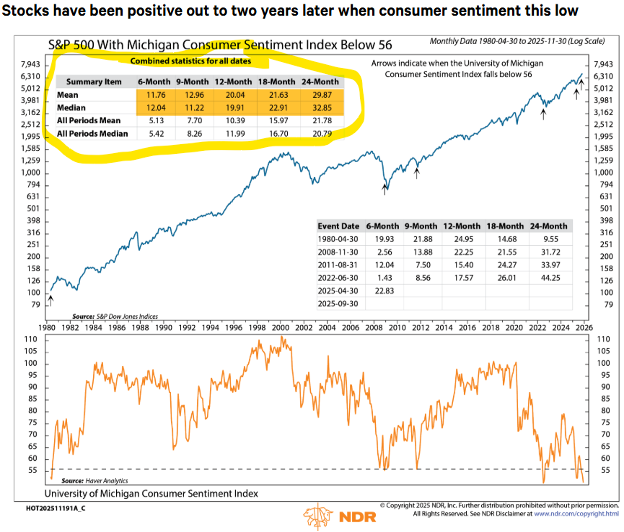
Consumers are much more pessimistic. Then there are other surveys of consumers that are bullish or neutral, with surprising levels of pessimism that suggest there is likely still money on the sidelines that could come into stocks. One from the Conference Board surveys consumers on how fearful they are about stocks. Earlier this year, after "Liberation Day," consumers were very fearful, which is contrarily bullish for stocks, as shown in how the market reacted. But even now, at record highs on stocks, they remain cautious, inconsistent with the lack of fear in 2000 or 2007 (as I had mentioned at the beginning of this note). The University of Michigan surveys consumers on how they feel about the economic outlook, currently and in the future. It shows near-record pessimism at 50.3. See where we are in the illustrations below going all the way back to 2006:
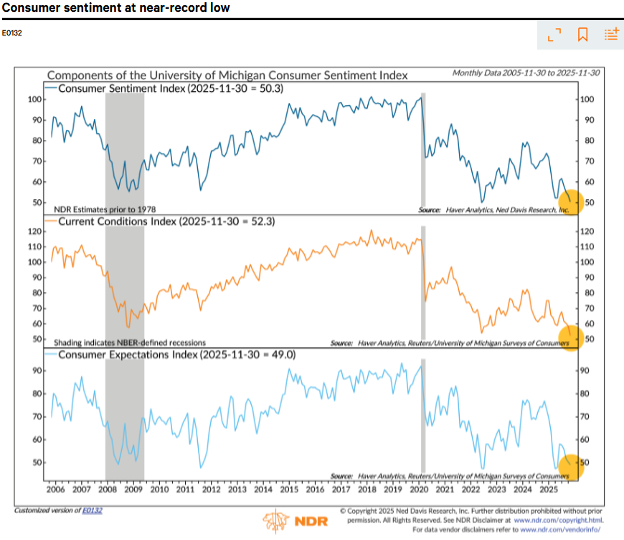
This brings me to the blatant factoid of this week’s note. When pessimism is below 56, NDR analysis shows gains in stocks 100% of the time, six to 24 months later. This is a small sample and hypothetical, but the survey goes back many years. It makes me wonder if crowd psychology is really that overdone.
In conclusion, I get the valuation/positioning gains that are leading many analysts to warn about high risks, as seen by the first three charts in this report. Yet, I believe in a weight-of-the-evidence approach to market analysis, especially with a friendly Fed and easy financial conditions. So, with many other psychological indicators giving conflicting readings, I believe that sentiment is mixed and not yet consistent with other major peaks.

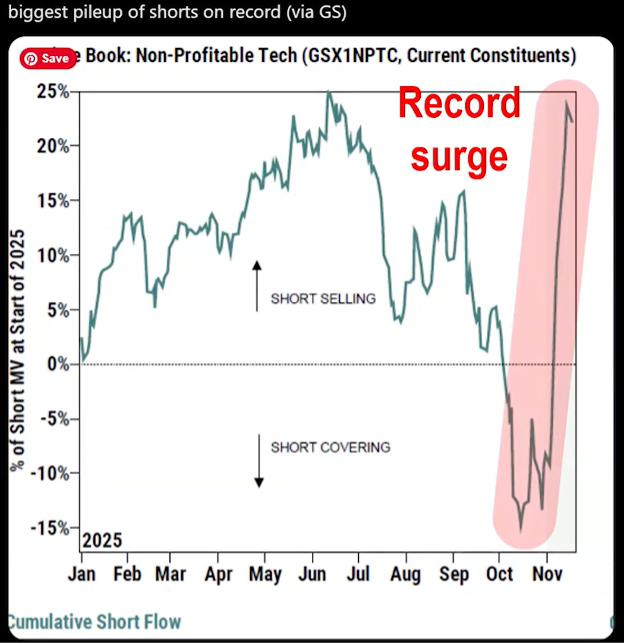
Prior to the bounce experienced late last week and continued this week, this is the record short selling that was recorded by Goldman Sachs research. Short selling is when speculative investors sell things they don’t own (short) to try and buy them back after a deep selloff. Note that this short record is almost at the same level as the Tariff Tussle:
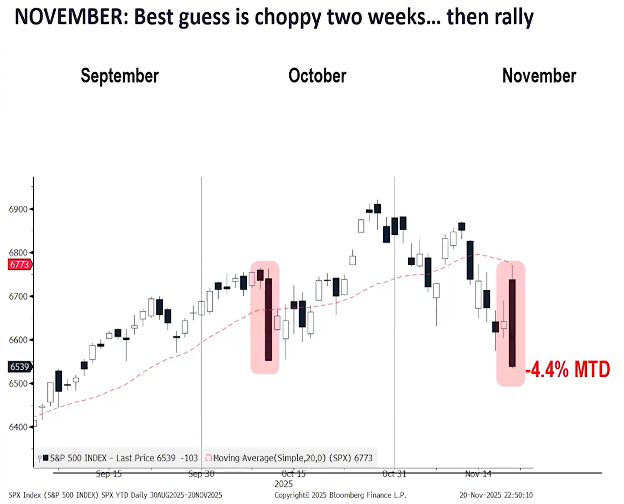
To get a little bit more granular, the markets are right back to where they were on the initial decline of October 10th. Note the highlighted bars in the chart below. October 10th in October segment, and Thursday, November 20th in the November segment. I don't know if I can remember a session quite like that. The S&P 500 fell around 3.5% from its high, marking its worst intraday sell-off since "Liberation Day" back in April. This doesn’t mean the lows are necessarily in, but rather that it looks pretty mechanical and computer trading related as it reversed at almost the exact same spot.
Have a very Happy Thanksgiving, and don’t fret. It looks like the Russia / Ukraine war is coming to a close. This should end the majority of the major conflicts and give room to trade opening up a bit more freely in the European Union. All are good things. Be well!
- Ken South, Tower 68 Financial Advisors, Newport Beach
-
Get Ken's Weekly Market Commentary Delivered To Your Inbox!
Important Disclosures:
The opinions voiced in this material are for general information only and are not intended to provide specific advice or recommendations for any individual. To determine which investment(s) may be appropriate for you, consult your financial professional prior to investing. All performance referenced is historical and is no guarantee of future results. All indices are unmanaged and cannot be invested into directly.
All information is believed to be from reliable sources; however LPL Financial makes no representation as to its completeness or accuracy.
Investing involves risks including possible loss of principal.
The Standard & Poor's 500 Index is a capitalization weighted index of 500 stocks designed to measure performance of the broad domestic economy through changes in the aggregate market value of 500 stocks representing all major industries. The S&P 500 is a stock market index tracking the stock performance of 500 of the largest companies listed on stock exchanges in the United States. Indexes are unmanaged and cannot be invested in directly.
The Dow Jones Industrial Average is comprised of 30 stocks that are major factors in their industries and widely held by individuals and institutional investors.
The Nasdaq-100 is a large-cap growth index. It includes 100 of the largest domestic and international non-financial companies listed on the Nasdaq Stock Market based on market capitalization.
The Russell 2000 Index is an unmanaged index generally representative of the 2,000 smallest companies in the Russell 3000 index, which represents approximately 10% of the total market capitalization of the Russell 3000 Index.
Data sourced from Bloomberg (2025).
Stock investing includes risks, including fluctuating prices and loss of principal.
Bonds are subject to market and interest rate risk if sold prior to maturity. Bond values will decline as interest rates rise. Bonds are subject to availability, change in price, call features and credit risk.
Government bonds are guaranteed by the US government as to the timely payment of principal and interest and, if held to maturity, offer a fixed rate of return and fixed principal value.
Bond yields are subject to change. Certain call or special redemption features may exist which could impact yield.
International investing involves special risks such as currency fluctuation and political instability and may not be suitable for all investors.
Alternative investments may not be suitable for all investors and should be considered as an investment for the risk capital portion of the investor’s portfolio. The strategies employed in the management of alternative investments may accelerate the velocity of potential losses.
This information is not intended to be a substitute for specific individualized tax advice. We suggest that you discuss your specific tax issues with a qualified tax advisor.
The economic forecasts set forth in this material may not develop as predicted and there can be no guarantee that strategies promoted will be successful.
LPL Tracking #830173