


It remains a challenge to get a handle on the economy. Perhaps we need to look no further than that to explain why the S&P 500 has gone nowhere since late October. To be quite a bit more exact, the S&P is flat for the year, the NASDAQ is down a little more than 1% and the DOW is up just a bit over 1%. Basically nowhere. An interesting factoid that Mark Newton pointed out last week is that the month of February has been the tightest range in the S&P 500 in over 40 years.
The data is all over the place, exacerbated by the effects of the government shutdown last year that interrupted collection of the inputs needed to publish that data. Last week, GDP estimates for the 4th quarter suggested the economy slowed considerably, much more than consensus expected. The government shutdown didn't exactly help with that either. At the same time, the Federal Reserve's preferred inflation gauge, the Personal Consumption Expenditures price index, accelerated in December at its fastest pace in nearly two years. The data is very squishy, but the combination of slower growth and higher inflation brings stagflation fears back into the picture.
Increasingly, it looks as if the economy and market will need to rely upon fiscal stimulus and consumer spending rather than much lower interest rates to keep the party going. Keep in mind, too, the midterm elections are coming up later this year, and the current administration will want to run the economy as hot as possible by the time voters cast their ballots. Consumers should begin to get a bump around now thanks to what is expected to be record tax refunds this year. While predicting something like tax refunds always comes with uncertainty, they are expected to increase around 10% above 2025 levels and a disproportionate amount of that influx of cash is expected to go to the bottom tiers of households that need it most. The question then becomes what do these households do with that collective windfall. There is plenty of evidence that the finances of the bottom 80% of consumers have become more strained over the past couple of years, with debt levels and credit delinquencies rising. Do consumers use their tax refunds to pay for what they have already purchased (with interest) or instead view it as a stimulus check and go buy even more with it? Does it really matter much if those consumers pay down debt, only to increase it once again in the months that follow? Regardless, there should be at least some partial help coming to many consumers over the next 2-3 months.
Monetary tailwind
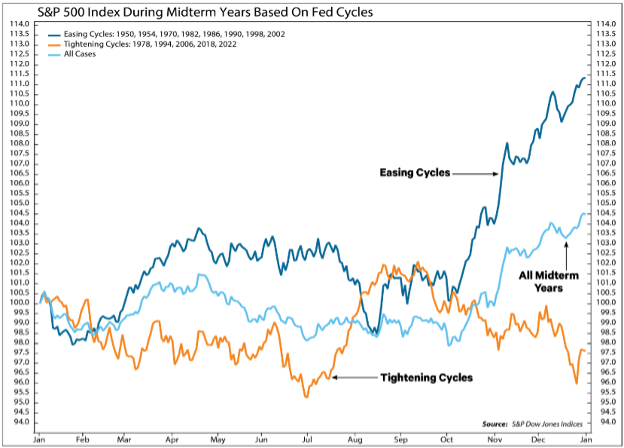
A friendly Fed has tended to mitigate the weak midterm year tendency for stocks.Average S&P 500 Index returns have been higher in midterm years during easing cycles (11.6%) than during tightening cycles (-2.5%). Yearend rally stronger in midterm years with easing cycles, on average.
Global central banks are also generally accommodative and fiscal deficits stay large, and rate cut expectations for 2026 are still solidly in place. These conditions tend to lift all boats eventually, even when individual sectors look bubbly or overextended. This also benefits from the still gigantic $7.2 Trillion sitting in cash earning massive amounts of interest that is sure to be spent or invested.
My base case is that liquidity continues to dominate over the course of 2026. The structural tailwind of abundant money usually finds a way to bid up stock prices unless something dramatic breaks the regime such as a serious recession, sharp inflation re acceleration, or geopolitical shock large enough to force real tightening. AI spending concerns are legitimate and could easily drive a deeper correction in the NASDAQ, but they are unlikely to kill the broader bull market while central bank liquidity remains this supportive.
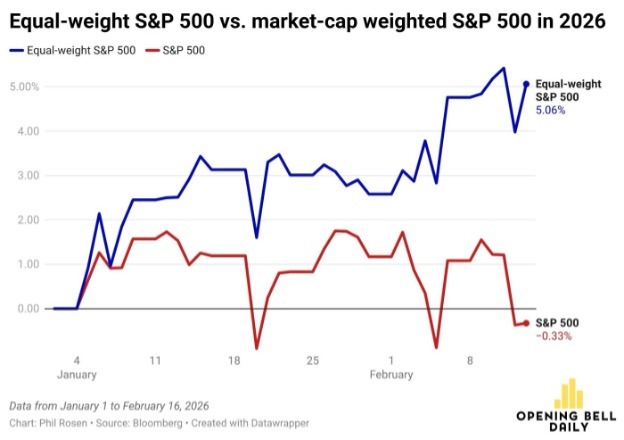
Further, the average S&P 500 stock is doing well while overvalued Big Tech has been weak. Capital has been rotating from tech to other sectors rather than leaving the market altogether. For the first time in years, gains are becoming less narrowly concentrated in a handful of trillion-dollar companies which has typically been a sign of improving market health as breadth and participation widen. If and when AI dominance returns, we will see it in the price/volume action of leading names. We don’t have to guess or speculate. That said, when things look the ugliest, that has often been the time major averages find their lows. Currently, this is what the general S&P looks like vs. the equally weighted version. Clearly, the difference is the rout in the big tech leaders and the negative effect of their collective declines on the overall cap weighted Index:
The real issue as I see it now is the one I had brought up just prior to Halloween last year. On October 28th of last year, I wrote my weekly note titled, “What is it that is masquerading as Jamie Dimon’s cockroach.” In the note, I wrote the following:
The aftermath of the Great Financial Crisis created a massive amount of new regulations within the banking system. As usual, after the horse had left the barn! So instead, the financing that is being provided today is being done by large private lending companies. In Barron’s this past weekend the lead article was about Blue Owl Capital and the vast private financing (non-bank lending) it is providing. The chairman of Blue Owl commented about Jamie Dimon’s post earnings report statement about two bankruptcies and how these were simply the beginning of a cockroach infestation in debt. Marc Lipschultz, the chairman of Blue Owl called this an odd form of fearmongering. Blue Owl, which began in 2020, is a fairly new upstart in the alt financing area, preceded by the likes of KKR, Carlyle, Apollo, and Blackstone just to name a few.
The reason I am bringing this up is that these private debt companies, which are completely unregulated by the FDIC or any other US Government sponsored agency are so flush with cash that they are providing debt financing at interest rates that are making the corporate lending firms almost noncompetitive. At the same time, why would a company go public, and give up management to a directorate board and part of the financial growth if they can borrow at very low rates and possibly a small amount of participation in the way of warrants or some other kind of participatory equity structure. George Walker, CEO of Neuberger Berman said, “It was just a start-up, and now their $26.6 Billion market cap compares to a number of large, century-old financial institutions.” This stunning trajectory of these private markets have tripled to $26 Trillion in assets over the past decade. according to a University of Massachusetts study.
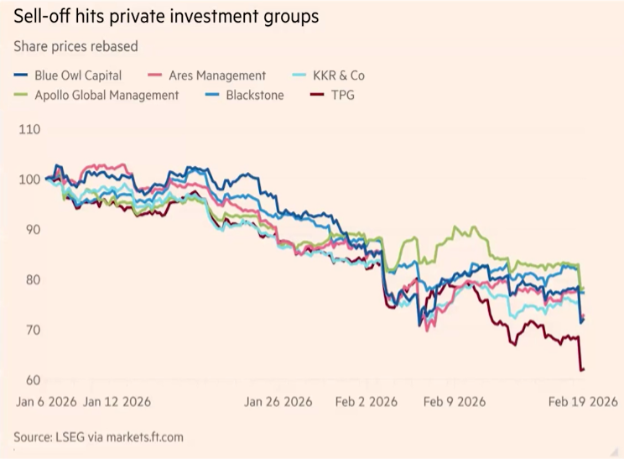
Well, what I feared came true last week when Blue Owl froze the ability to liquidate their Private Debt Funds. This is very similar to the Auction Rate Preferred issue a decade ago. This, on top of the Iran conflict were the flies in the ointment in the markets this past week. This brings us to MY FAVORITE FEAR GUAGE: When it comes to monitoring risk, there’ an old Wall Street adage: “credit leads, equity follows.” There is a small fraternity of companies involved in this concentration of Private Debt offerings. This is how they are faring currently. NOT GOOD!
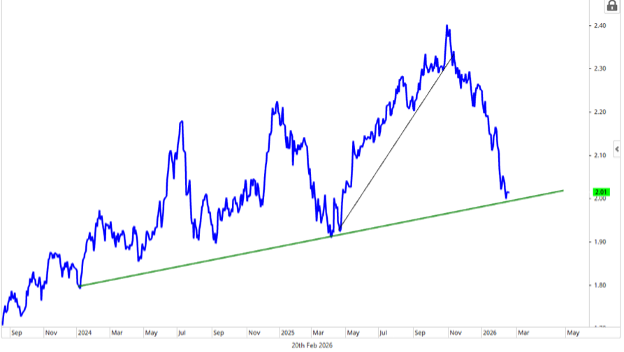
Beyond this statement about how risky debt instruments are being treated, I find that the best way to monitor debt in general and its opinion on future economic prosperity is the spread between hi-yield debt and highly rated debt. As logic would have it, if the markets feel that the economy is going into a slowdown and that there might be a rash of debt default as companies slow and can’t pay off their debts, then the spread between risky and non-risky debt would widen. This is not the case currently. This is how this spread has actually contracted over recent history.
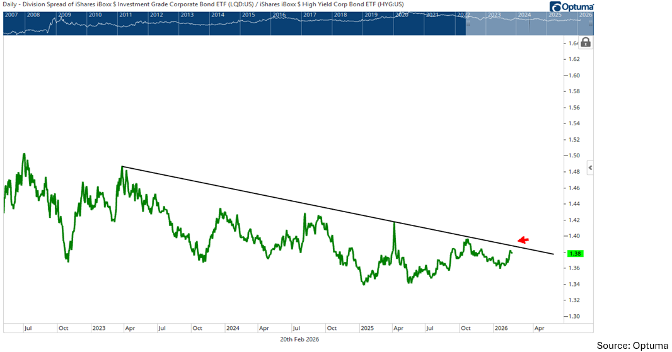
High yield spreads haven’t shown evidence of widening too dramatically just yet. Given all the recent news surrounding Blue Owl, many investors are wondering if private credit woes will turn out to be the catalyst that causes the stock market to show consolidation this spring. While I don’t have many ways to evaluate this area, I always find it helpful to watch the ratio of Investment Grade Corporate bond ETFs vs. High Yield Corporate ETF, for evidence that this is turning higher as I had mentioned above. As seen in the chart above, while this ratio did bottom out in early 2025, there hasn’t been sufficient economic fear to cause a larger widening, which might portend relative weakness in High-yield securities. Parts of Technology certainly look a bit worse at the moment than the broader market but keeping a close eye on this ratio is at least one way to normally identify times when the high-yield market is starting to exhibit deterioration.
Earnings season is also winding down, with around 82% of S&P 500 companies now having reported. While earnings, on balance, have come in a little better than they looked at the beginning of the season, we're still not seeing as many strong positive earnings reactions as we have in quarters' past. It does make it more difficult to "invest in the future" because "the future" seems to be changing so rapidly. The uncertainty extends not only to earnings over the next few years but the terminal values of businesses that play such a large role in valuing those businesses (terminal values go way down if the market begins to fear a company might not even be around in five years due to AI competition). The good news is that the increased fears have knocked many stocks down to oversold levels that we rarely see; the bad news is that so far buyers have been less enthused about taking chances on these stocks with the impacts of AI still unknown. There have still been winners in the market.
To say that there has been a bit of passing of the baton, as I’ve referenced in the past couple of weeks. Here is the picture of growth vs. value. Clearly growth has outperformed value overall going back to the mid-2023, but there are clearly spates of growth underperformance, as we have experienced since late September.
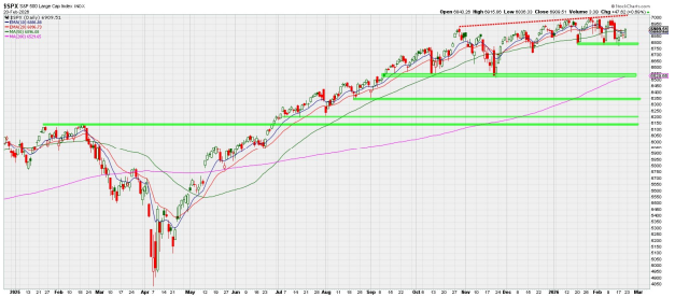
I don't know if I'd call the recent action "boring" per se, but for all the action in individual stocks, we just aren't seeing much movement in the major indices. Getting the tariff decision does remove one wildcard, though there are still escalating tensions with Iran to consider. A lot of hardware has headed for the Middle East, and it looks increasingly likely that it will be used in some capacity. The question then becomes how limited any strike will be and how limited it will remain depending on the response it elicits. War is not necessarily "bad" for the markets, but it is a wildcard, especially if oil prices throw a tantrum. If we throw these points together with the shut down of Blue Owl redemptions and Mexican drug cartels going crazy in resort towns in the Baja Peninsula, the stage was set quite well for shaking of the tree Monday of this week. As it stands, this is what the market looks like with support and resistance lines drawn below and above the tight range it has remained in:
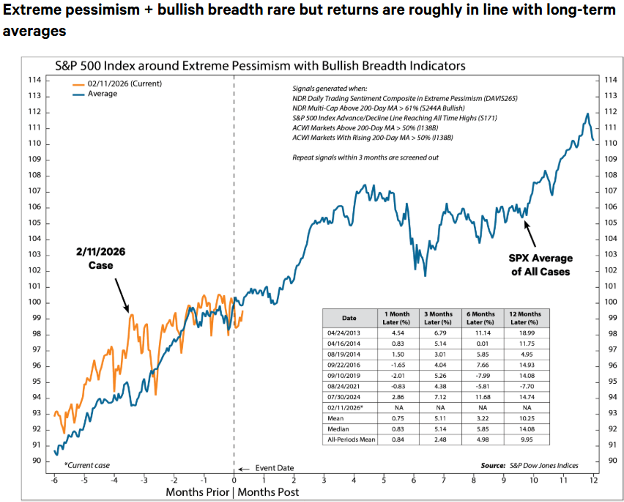
In closing, I wanted to take a moment and show what has tended to happen when there is extreme pessimism (as there is currently) with consistently bullish breadth data (as there is currently). I bring this up as Ned Davis Research did a very unique study that shows that what we are experiencing right now is very consistent with what has happened in history.
As I have attempted to share since mid-January, we are in a bit of an “iffy” time, yet the underlying economics of stable debt credit spreads, positive earnings growth, and stable and growing economy tends to lead to stable to positive market outcomes overall.
We will continue to keep you informed of the issues we feel are relevant and how one should approach the markets given what hand we are playing both domestically and abroad.
- Ken South, Tower 68 Financial Advisors, Newport Beach
-
Get Ken's Weekly Market Commentary Delivered To Your Inbox!
Important Disclosures:
The opinions voiced in this material are for general information only and are not intended to provide specific advice or recommendations for any individual. To determine which investment(s) may be appropriate for you, consult your financial professional prior to investing. All performance referenced is historical and is no guarantee of future results. All indices are unmanaged and cannot be invested into directly.
All information is believed to be from reliable sources; however LPL Financial makes no representation as to its completeness or accuracy.
Investing involves risks including possible loss of principal.
The Standard & Poor's 500 Index is a capitalization weighted index of 500 stocks designed to measure performance of the broad domestic economy through changes in the aggregate market value of 500 stocks representing all major industries. The S&P 500 is a stock market index tracking the stock performance of 500 of the largest companies listed on stock exchanges in the United States. Indexes are unmanaged and cannot be invested in directly.
The Dow Jones Industrial Average is comprised of 30 stocks that are major factors in their industries and widely held by individuals and institutional investors.
The Nasdaq-100 is a large-cap growth index. It includes 100 of the largest domestic and international non-financial companies listed on the Nasdaq Stock Market based on market capitalization.
The NASDAQ Composite Index measures all NASDAQ domestic and non-U.S. based common stocks listed on The NASDAQ Stock Market. The market value, the last sale price multiplied by total shares outstanding, is calculated throughout the trading day, and is related to the total value of the Index. Indexes are unmanaged and cannot be invested in directly.
The Russell 2000 Index is an unmanaged index generally representative of the 2,000 smallest companies in the Russell 3000 index, which represents approximately 10% of the total market capitalization of the Russell 3000 Index.
Data sourced from Bloomberg (2025).
Stock investing includes risks, including fluctuating prices and loss of principal.
Bonds are subject to market and interest rate risk if sold prior to maturity. Bond values will decline as interest rates rise. Bonds are subject to availability, change in price, call features and credit risk.
Government bonds are guaranteed by the US government as to the timely payment of principal and interest and, if held to maturity, offer a fixed rate of return and fixed principal value.
Bond yields are subject to change. Certain call or special redemption features may exist which could impact yield.
International investing involves special risks such as currency fluctuation and political instability and may not be suitable for all investors.
Alternative investments may not be suitable for all investors and should be considered as an investment for the risk capital portion of the investor’s portfolio. The strategies employed in the management of alternative investments may accelerate the velocity of potential losses.
This information is not intended to be a substitute for specific individualized tax advice. We suggest that you discuss your specific tax issues with a qualified tax advisor.
The economic forecasts set forth in this material may not develop as predicted and there can be no guarantee that strategies promoted will be successful.
LPL Tracking #1069256