


Initial Key Takeaways:
- Biden’s late withdraw is unprecedented, but there are five loose historical comparisons
- The incumbent not seeking reelection has not prevented the second-half election-year rally.
- Earnings revisions are a bigger concern than politics over the near term.
A Year of firsts
As market historians, we get excited about rare market events. They provide an opportunity to put market action into perspective and draw historical parallels. Keeping our historian hats on, this presidential election cycle has been filled with firsts. This year was on track to be the first since 1892 that both major party candidates had been president. Trump is the first former president convicted of felonies. He is also the first candidate shot on the campaign trail since 1972.
First amongst firsts
And for the biggest bombshell, Biden withdrew from the race on July 20, the latest from a presumptive nominee in modern presidential history. We see one true historical comparison, and it is far from perfect. In 1968, incumbent Lyndon Johnson withdrew from the race after a poor performance in the New Hampshire primary. He exited on March 31, four months earlier than Biden. Voters, and investors, had plenty of time to adjust. The stock market rallied, with the DJIA adding about 5.7% over the next two weeks. The benchmark never fell below its March lows through year-end, enjoying a 19.4% rally into early December.
Loosening the criteria, there are five cases since 1900 when the incumbent chose not to seek reelection. All but one occurred before the 22nd amendment established presidential term limits. The lack of an incumbent did not derail the typical second-half election-year rally (see chart below).
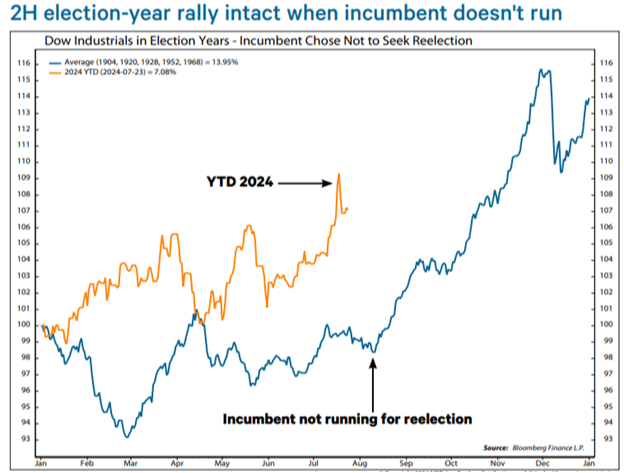
Another conclusion is that the market is driven by more than politics. Earnings will likely have a bigger impact on the market in the second half. I am not a big believer in using historical analog charts. I think every environment is different and so expecting the current market to play out exactly like a past one rarely works out the way that some believe it will. Still, it doesn’t hurt to at least keep them in mind. In the case of a sitting president dropping out of a reelection race, the only modern parallel we have is the 1968 election. It’s not an apples-to-apples comparison, of course, but in 1968 the Dow Jones Industrial Average traded sideways over the summer before bottoming out in early August. It then went on a tear until the start of December when it finally pulled back in heavier fashion as can be seen above.
Previous Two Elections for immediate perspective
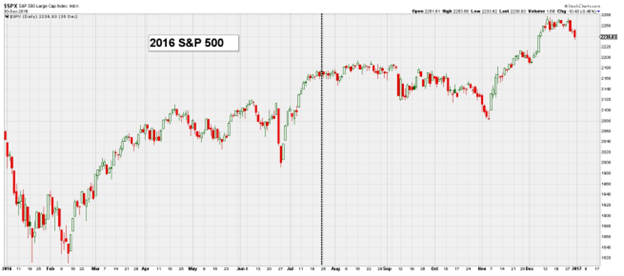
Very similarly, the 2016 election year saw the S&P 500 hang in there until around the start of September before a softer patch into election day. Then, once again, we got a rally into the end of the year. In both 2016 and 2020, the market slowed in the two months leading up to the election and then took back off. As a result, I expect many people will be watching for a similar post-election rally once again. To me, that suggests we should perhaps be on alert for something else to happen if everyone will be leaning the same way.
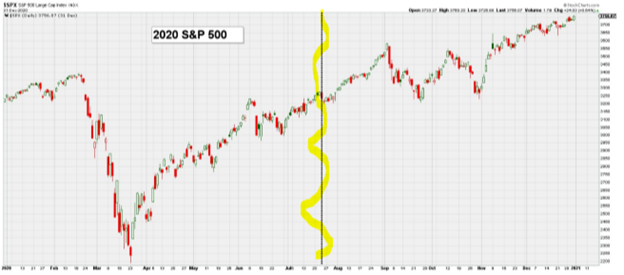
More recently, I guess it’s worth at least looking back at the most recent presidential election season as well, for perspective. The chart below shows the S&P 500 in 2020, when Joe Biden defeated Donald Trump in November. The vertical line, highlighted in yellow, shows where we are now, and in this picture the market rallied into early September before going sideways into the actual election. Afterward, we saw a rally into year-end. Of course, this was also the COVID year when people were being sent money to spend by the government and everyone was sitting at home shopping and day trading. Not a perfect comparison, but there it is.
A quick recap of history
The most comparable year, 1968, was described above and was shown in the the chart above. So, let’s discuss the four other cases. 1908 was the first one. In his 1904 acceptance speech, Theodore Roosevelt announced that he would not run in 1908. Teddy assumed the presidency when McKinley was assassinated in 1901, so he was adhering to Washington’s precedent of not running for a third term. Although he was floated in 1908, T.R. threw his support behind his vice president, Taft. The DJIA soared 46.6% in 1908 as Taft was viewed as a continuation of T.R.’s policies. 1920 was next. Even though he had been weakened by a stroke in October 1919, Woodrow Wilson let it be known he would be interested in a third term. He was never seriously considered at the Democratic convention. The DJIA tumbled 32.9% as the economy suffered from a severe recession due to hyperinflation after WWI and the Spanish flu. Next was1928. Calvin Coolidge assumed the presidency after Harding’s death in 1923, so another term would have been consistent with precedent. When asked, “Silent Cal” only said, “I do not choose to run.” Some wondered if he hoped for a groundswell of support, but Republicans chose Hoover. The DJIA jumped 48.2%, as investors viewed Hoover as a continuation of Republican Laissez-faire policies. Then it was 1952. The 22nd amendment was ratified in 1951, but Truman was grandfathered. Due to low approval ratings and a poor showing in the New Hampshire primary, Truman announced on March 29 that he would not seek reelection. The DJIA bottomed on May 1 and rallied 13.9% through yearend.
In the final analysis, it’s the earnings, stupid!
Democratic strategist James Carville coined the phrase, “it’s the economy, stupid” to frame the 1992 election. To paraphrase Mr. Carville for the stock market in 2024, “it’s the earnings, stupid.” The recovery from the mild earnings recession in 2022 has been one of the keys to the bull market. Earlier this year, I what I was focusing on for this quarter’s earnings season. While too early to draw conclusions, a few things (that I will cover in future reports in greater detail) could be directly linked to the recent pullback. Two of the keys were the beat rate and Mag 7’s high expectations. Both took a hit with Tesla and Alphabet’s earnings. The S&P 500’s beat rate is a solid 80.2%. However, Technology sector’s is at 60.0%, the lowest since Q4 2008. Only 7.5% of Tech companies have reported, so it is far too early to draw conclusions, but Q2 earnings season is not off to a great start for the biggest sector (action out of Alphabet this week started this). Another key was second-half estimates. Q3 and Q4 year/year growth rates were close to 20% coming into earnings season. The question was not whether they would be revised down, but when and by how much. Since the end of June, both have dipped slightly, but they are still calling for hockey-stick like growth in the second half. Even if Q3 and Q4 earnings growth settle in the low double digits, which would reflect quarter/quarter acceleration, the process of revising growth rates down could be messy.
As I’ve said, history provides precedent, but never the same. Things tend to rhyme. In the end, it should be most dependent on earnings and the fuel (provided or not) by lower interest rates and cheaper financing after the sharp interest rates the Fed imposed earlier. We will certainly keep you apprised, but for now, I felt perspective would be important and quite interesting to all those that choose to follow closely.
- Ken South, Newport Beach Financial Advisor
Get Ken's Weekly Market Commentary Delivered To Your Inbox!
Important Disclosures:
The opinions voiced in this material are for general information only and are not intended to provide specific advice or recommendations for any individual. To determine which investment(s) may be appropriate for you, consult your financial professional prior to investing. All performance referenced is historical and is no guarantee of future results. All indices are unmanaged and cannot be invested into directly.
All information is believed to be from reliable sources; however LPL Financial makes no representation as to its completeness or accuracy.
Investing involves risks including possible loss of principal.
The Standard & Poor's 500 Index is a capitalization weighted index of 500 stocks designed to measure performance of the broad domestic economy through changes in the aggregate market value of 500 stocks representing all major industries.
The Dow Jones Industrial Average is comprised of 30 stocks that are major factors in their industries and widely held by individuals and institutional investors.
The Nasdaq-100 is a large-cap growth index. It includes 100 of the largest domestic and international non-financial companies listed on the Nasdaq Stock Market based on market capitalization.
The Russell 2000 Index is an unmanaged index generally representative of the 2,000 smallest companies in the Russell 3000 index, which represents approximately 10% of the total market capitalization of the Russell 3000 Index.
This information is not intended to be a substitute for specific individualized tax advice. We suggest that you discuss your specific tax issues with a qualified tax advisor.