


Last week was an interesting one. Fed Chair Powell had forecasted and warned of an impending rate cut, but didn't clarify how much or when. The market seemed to be pretty OK with the 1/2 a point cut when it was first announced, and then it promptly did an about face and closed down for the day. Not to be denied, as has normally been the case, the broad market did the opposite of the initial Wednesday move on Thursday and ripped to the upside. Friday was an option expiration day and therefore some of the expected action on Friday was not out of the norm. So, what next? The start of a Fed rate cutting cycle is always a momentous occasion. Markets usually cheer (as they did last week), as lower interest rates and prospects for future cuts ease financial tightness and boost equity valuations. The modest wobble last week on the day of the announcement occurred as market participants pondered what the first cut might mean for the economy and what it might portend for stock prices. In today’s note I will go into what has historically been the case and will finish with the current problems lurking under the surface.
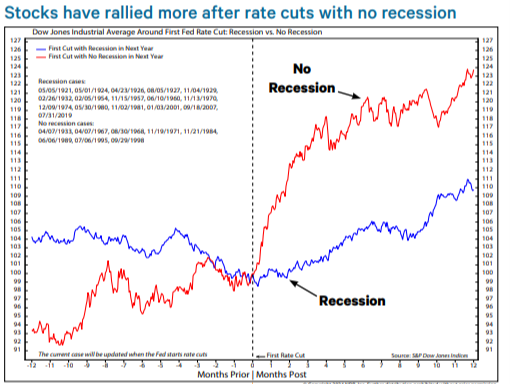
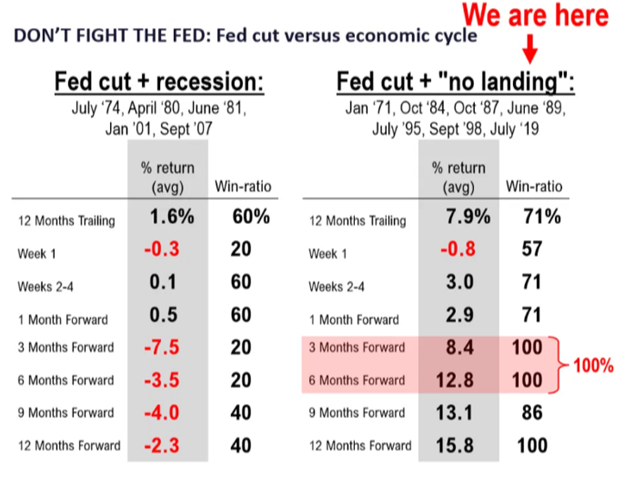
From my desk, the market reaction to the Fed's decision appeared quite normal with varied sentiments and opinions testing the decision in the days immediately following. Again, I find myself asking the question, what next? Besides this week having a fair number of economic indicators being released, which will be sure to either validate the amount of the cut or make it sound like it didn’t need to be that large. Also, things should be a bit quiet going into October 11th when the Q3 earnings get underway with the big banks kicking it off. Of course, I can’t speak to the unknown and continued political discord, but just following the facts, this is what I expect. In looking at the broad market as measured by the S&P 500, the determining factor is expected to be what happens to the equity market when there is a rate cut that isn't in the face of a recession. As seen below, markets tend to be pretty happy in this case.
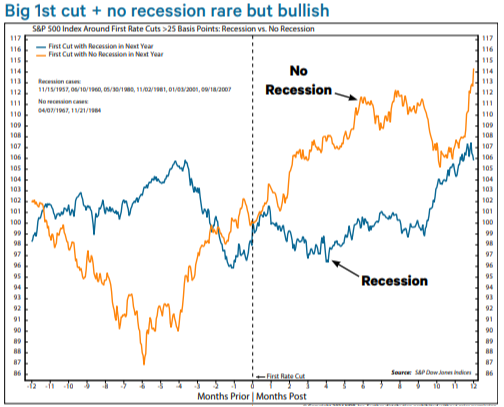
Another point is that what happens when the Fed cuts big in its first cut when there is no recession is quite rare, but also bullish. I say this as it appears a bit strange that the Fed would hit the rates this hard when there is no recession in sight from the aspect of job hiring and unemployment. Job openings are still growing, and the unemployment rate is staying stubbornly low at 4.2%. Now, take a moment and compare the average action of the markets following a rate cut in a non-recessionary environment to the chart below with fine tunes this action a bit more by assuming the rate cut is a big one (1/2 instead of 1/4):
Powell's explanation was logical in his post meeting press conference. He has kept monetary policy extremely restrictive to reign in 9% inflation post the COVID cash dump. Now that the inflation is approaching the Fed's target and the labor market is softening, quickly moving to a less restrictive policy makes sense. The 1/2-point move is not as rare as many might think as the Fed has slashed by more than 1/4 in nine out of 18 initial cuts since 1954. What is rare is that this time it was done at a time when the Fed did not see major risks to the strength of the economy if they DIDN'T do it. I believe that the stock market liked it as it signaled a decisive shift in monetary policy. I say this given that the Fed felt compelled to start with 1/2 instead of 1/4, and it would therefore be a probable assumption to expect the Fed will cut rates further by another 1/4 in both November and December- if the economic data warrants such moves.
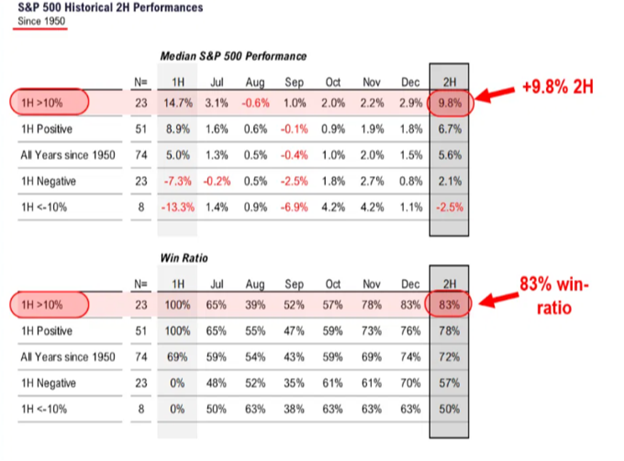
The next fact that I looked for to give me an indication of a stronger equity market in the immediate future or not was based on two measures that I feel are relevant. First, what does the second half of the year tend to do when the first half is up over 10%. Since 1950, 83% of the time there has been a positive outcome with an average return of almost 10%. Not a bad follow up to the strong year we have enjoyed thus far.
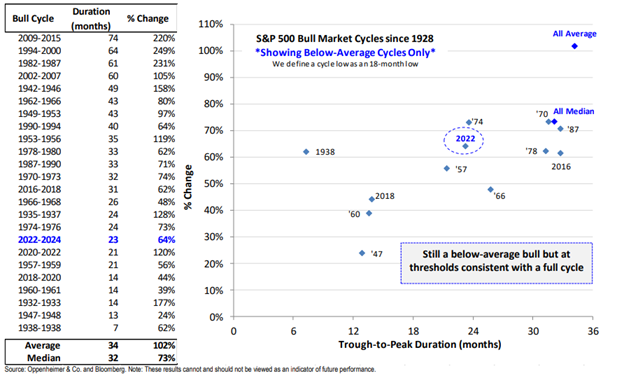
The second question that I solved for is this: given that the market has been as strong as it has since the low back in 2022, where does this advance fit in the normal cycle? The S&P 500 is up 64% over the 23 months between October 2022 and September 2024. Since 1932, the median bull cycle has gained 73% over a 32-month period. This leads me to see the possibility of the S&P at 6,000 sometime in the first half of 2025 as "fair value" for an average bull cycle.
In the end, it often proves futile to fight the Fed and wait for a better time to invest in a pullback. I mean this to say, at least not yet. This has been historically validated by the 100% occurrence of the market being higher 3 months and 6 months out:
All this looks pretty darn convincing, yet there are some things that are truly bothering me that are again, "never before been seen" kinds of moments lurking underneath the surface. The problem I see is with the growing deficit on the spending side. And while many just chalk it up to Social Security and Medicare because of our aging population, this just isn't true. There are three major factors:
- Net interest on the Federal debt.
- "Other” mandatory spending such as student loans and growing government salaries.
- Major health care programs, such as Medicare (for senior citizens) and Medicaid (for those with lower incomes).
Bottom line is that the US faces big structural budget challenges in the years ahead, particularly on the spending side. With low interest rates for the past 15 years, we had the chance to hide our eyes from the problem, but we are soon to run out of time. No matter who we elect in November, we expect getting our fiscal house in order to eventually become a major policy theme of the next Administration as well as those beyond.
Treasury Budget blows up. Released hours late Thursday, the Treasury revealed an additional massive budget deficit as the Federal government spent $668B in August, one of the largest splurges ever, even considering the covid era. As we had discussed in the early months of this year, the federal government would spend as necessary to forestall any nationwide recession showing up ahead of the election. Bingo. No wonder Treasury opted to release the data well after the market closed. Further, this spending splurge pushed the interest on the national debt for the first 11 months of the fiscal year to over $1T. Another first for the Biden administration. Not annualized; just the first 11 months. If the government spends this way again in September, by fiscal year end the interest could be 1.6T.
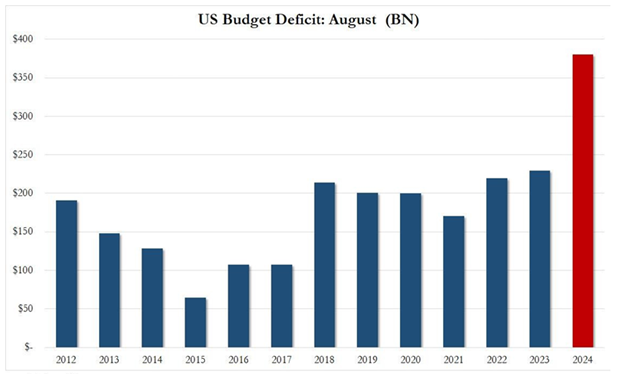
Drunken sailors
The August budget deficit hit a staggering $380 billion as can be seen in the chart above. I included this chart so that the August number could be seen relative to past years. The Biden administration intentionally spent big to reboot the economy. It appears they did so to avert a recession just in time for the elections. Outlays hit $668 billion, the highest since March 2023, and only a handful of crisis months during the covid crash saw greater government spending in any given month. Keep in mind this does not include stealth QE where spending has been greater since Jan-2023 than during the first two years of COVID. So of course, the Biden admin will spend what it takes to paint the political tape.
What convinces me of this being a disastrous situation possibly moving forward is what the market seems to be telegraphing. Just when the Fed chops short-term interest rates by a 1/2, the 10-30 years rates are moving higher. To me this is implying the fear of inflation reigniting itself given rates are being cut without a recession staring us in the face. Also, monstrous government spending immediately before an election. I am not trying to be a conspiracy theorist, but I am really quite suspect of such a large rate cut and such massive spending being done coincidentally in front of the election to pump up the incumbent party.
What the future holds is really quite unknown given such a strange set of variables currently in place. We have a strong consumer- which makes up 70% of our economy, ample amounts of cash still sloshing around, job growth slowing- but still positive, wages stable, and unemployment still on a slight decline. All told, the economy is still fine. So, in looking at past markets, it appears that the good times could continue, for at least another 3-6 months, and then whoever ends up in office will probably address the painful realities of reigning in government spending to hopefully protect future generations. Will this be good for the markets? That seems a bit questionable, but every week we will be looking at all things and providing you what we believe should be observed to make sure you are positioned as you should for your long-term and short-term objectives.
- Ken South, Newport Beach Financial Advisor
Get Ken's Weekly Market Commentary Delivered To Your Inbox!
Important Disclosures:
The opinions voiced in this material are for general information only and are not intended to provide specific advice or recommendations for any individual. To determine which investment(s) may be appropriate for you, consult your financial professional prior to investing. All performance referenced is historical and is no guarantee of future results. All indices are unmanaged and cannot be invested into directly.
All information is believed to be from reliable sources; however LPL Financial makes no representation as to its completeness or accuracy.
Investing involves risks including possible loss of principal.
The Standard & Poor's 500 Index is a capitalization weighted index of 500 stocks designed to measure performance of the broad domestic economy through changes in the aggregate market value of 500 stocks representing all major industries.
The Dow Jones Industrial Average is comprised of 30 stocks that are major factors in their industries and widely held by individuals and institutional investors.
The Nasdaq-100 is a large-cap growth index. It includes 100 of the largest domestic and international non-financial companies listed on the Nasdaq Stock Market based on market capitalization.
The Russell 2000 Index is an unmanaged index generally representative of the 2,000 smallest companies in the Russell 3000 index, which represents approximately 10% of the total market capitalization of the Russell 3000 Index.
This information is not intended to be a substitute for specific individualized tax advice. We suggest that you discuss your specific tax issues with a qualified tax advisor.